
Liverpool Financial Results 2024/25
- Matchday Finance
- Mar 8
- 16 min read
Updated: Mar 25
The 2024/25 season marked Liverpool’s 63rd consecutive year in the top flight and the first under manager Arne Slot.

It proved to be a historic campaign. By February, Liverpool were leading the Premier League by a significant margin, having lost just once at home to Nottingham Forest. They reached the Carabao Cup final and finished top of the newly formatted Champions League league phase. Although defeat to Newcastle in the Carabao Cup final and elimination to eventual winners Paris Saint-Germain in the Champions League knockout stage were setbacks, Liverpool maintained their domestic form and secured the Premier League title, finishing ten points clear of Arsenal.
This season, however, has been more challenging. The club invested heavily in the summer transfer window, spending over £400 million on new signings, including a British-record fee for Alexander Isak alongside major additions such as Florian Wirtz and Hugo Ekitike. Integration of the new players has taken time, and the season was further overshadowed by the tragic loss of Diogo Jota in a car accident. At the time of writing, Liverpool sit sixth in the league, outside the Champions League qualification places, though they finished third in the Champions League league phase.
Liverpool have been owned by Fenway Sports Group (FSG), led by John W. Henry, since October 2010. FSG acquired the club during a period of financial instability and have since focused on sustainable growth and infrastructure investment, stabilising the club financially while overseeing one of the most successful periods in its modern history.

Although there has been criticism in the past regarding relatively cautious transfer spending — with Liverpool historically spending less than several domestic rivals — the significant investment this season represents a major shift in approach. The financial impact of that spending will be reflected in future reporting periods through increased amortisation charges and a likely higher wage base.
Liverpool Women's Football Club
These results are based on The Liverpool Football Club and Athletic Grounds Limited, which also includes Liverpool Women’s Football Club. As a result, the revenues and costs of the women’s team are consolidated within these figures.
In 2024/25, the women’s team recorded turnover of £6.1 million and operating costs, including salaries, of £5.9 million.

Liverpool Financial Results 2024/25
Liverpool’s Championship-winning season delivered club record-breaking, league-leading revenue of £703 million. Salaries increased—likely driven by bonus payments—and were the highest in the league. However, with £52 million generated from player sales, the club reported a pre-tax profit of £15 million and are the only one of the seven clubs to have reported their results so far to avoid a loss.

Financial highlights:
Revenue: Total revenue reached a record £703 million, up £88 million year-on-year, with growth across all major revenue streams. A return to the Champions League and domestic success were the main drivers.
Staff costs: Salaries and wages rose by £42 million to £428 million, the highest in the league, likely lifted by bonus payments following their league success. Total staff costs reached £545 million, likely ranking as the third highest in the league.
Player sales: The club generated £52 million from player sales, primarily from van den Berg and Carvalho.
Profit/loss: The club reported a profit of £15 million, the only club to report a profit among the seven clubs that have reported so far.
Net assets: Net assets increased slightly to £159 million, reflecting a decrease in outstanding loans.
Player trading: Liverpool spent £102 million on new players — likely the 13th highest spend in the league — with Mamardashvili, Chiesa and Frimpong joining the club. This was largely offset by £57 million in player sale income.
Loans and debt: External borrowings totalled £258 million at the end of 2024/25, offset by £6 million in cash reserves. Of this debt, £218 million is owed to the parent company. Meanwhile, net transfer-related debt fell by £15 million to £55 million.
Cash Flow: The club generated £103 million in operating cash flow, likely the second highest in the league, while recording a net investment outflow of £79 million and repaying £30 million of outstanding debt.
Financial Outlook
Whilst things on the pitch have not quite gone to plan this season, and the club spent record amounts on the squad, the financial outlook still remains strong. This year’s revenue will depend largely on their Champions League performance. It is already clear that they will finish lower domestically, which will reduce league-related revenue, but any progress in the Champions League would provide significant financial returns.
Costs will increase following the transfer market splurge, with player amortisation likely to rise by £60–80 million. However, the club is also expected to record more than £100 million in player sales profits. Overall, we estimate that the club will report a roughly break-even result for the year.
Cash flow may be more challenging. The scale of this will depend on the payment structures agreed for recent player acquisitions, which will almost certainly be spread over several years. Even so, we estimate the club may require external funding of around £100 million to meet upcoming transfer fee instalments.
There is also a risk that the club fails to qualify for the Champions League, as happened in 2023/24, which would have a significant impact on next year’s financial results.
However, the club remains one of the leading teams in European football on the pitch and domestically one of the most commercially successful club off it.
Turnover
Revenue is generated from three primary streams: matchday income (ticket sales), broadcasting distributions (from the Premier League and, where applicable, UEFA competitions), and commercial activities, including sponsorships, merchandising, and other business operations.
The 2024/25 season was another record year for Liverpool, with revenue growth across all major streams driven by their league title win, participation in the Champions League, and higher attendances.

To date, seven clubs have published their financial results — Arsenal, Brentford, Brighton, Liverpool, West Ham, Manchester City and Manchester United. The chart below compares reported figures for these clubs with our revenue estimates for the remaining Premier League teams. Liverpool generated the highest revenue in 2024/25, narrowly ahead of Manchester City and Arsenal.

Compared to Europe’s leading clubs, Liverpool’s revenue ranks fifth, behind only the two Spanish giants Real Madrid and Barcelona, as well as Paris Saint-Germain and Bayern Munich.
Matchday Revenue
Matchday revenue is driven by several factors, including the number of home fixtures, average attendance, ticket pricing, and a club’s ability to optimise hospitality and premium seating. Domestic cup competitions are an exception, as gate receipts are shared between the participating clubs and the FA.
Liverpool have played at Anfield since 1892, and it remains one of the most historic grounds in English football. Following the recent expansion of the Anfield Road Stand, the stadium now has a capacity of 61,276, making it the fourth-largest in the Premier League and now ahead of Arsenal. The 2024/25 season was the first full campaign following the expansion, which lifted average league attendance to 60,330, up from 55,890 the previous season.
Surprisingly, the club has a relatively low number of season tickets, reportedly around 27,000–30,000, which is only around 50% of capacity. This is low for a Premier League club and allows Liverpool to sell more general admission tickets, typically at higher prices. This clear commercial decision has frustrated supporters, particularly given the very long waiting list for season tickets.

In 2024/25 the club played the same number of European matches as the previous season (having participated in the Europa League), but were involved in three fewer domestic cup matches where revenue is shared. However, the increased capacity lifted the number of paying fans by 4% to 1.58 million.
Hosting higher-value Champions League matches and a modest (2%) season ticket price increase helped lift the average revenue per fan to £72.91, up from £66.77 the previous season. This is the fifth highest in the league, behind the three big London clubs and Manchester United.
The combination of additional capacity and increased revenue per fan lifted Liverpool’s matchday income to a club-record £115.6 million.


While the table below includes revenue estimates for clubs that have yet to publish their accounts, Liverpool’s matchday income ranks fourth highest in the league. Manchester United currently have the highest, although they are set to be overtaken by Arsenal this year, as United are not participating in European competition.

Broadcast Revenue
Broadcast revenue is generated primarily through central Premier League distributions, UEFA payments from European competitions and the club’s own media activities.
The 2024/25 season marked the third and final year of the Premier League’s current broadcast cycle, with total distributions broadly consistent with 2023/24 levels. Approximately 67% of broadcast income is shared equally among clubs, with the remainder allocated through merit payments based on league position and facility fees linked to the number of live televised matches.
Liverpool earned the maximum Premier League distributions following their Championship-winning season.

The chart below shows the club by club distributions published by the Premier League.

The new formats for UEFA’s three club competitions increased overall distributions by approximately 20%. Revenues are allocated across three components: an equal participation share, performance-based prize money, and a market value component, which is determined by the size of the TV market (with the UK being the largest) and a club coefficient based on results over the past five seasons. Roughly 75% of total revenues are distributed to Champions League participants, 15% to Europa League clubs, and 10% to Europa Conference League teams.
Although Liverpool topped their group, they were eliminated in the round of 16 by eventual winners Paris Saint-Germain, which earned them £83 million.

The club was the second highest-earning of the seven English teams competing in European competitions in 2024/25.

The chart below shows combined broadcast revenue, including Premier League distributions, UEFA payments, and income from the recently expanded FIFA Club World Cup, which was contested only by Chelsea and Manchester City.

Commercial Revenue
Liverpool’s commercial revenue has continued its upward trajectory, with the 2024/25 season setting a new record of £323 million. The club reported strong growth across partnerships, retail, and non-matchday events, including Anfield concerts featuring international superstars Taylor Swift and P!NK.
Liverpool’s kit is supplied by Adidas, reportedly worth £75 million annually. The front-of-shirt sponsorship with Standard Chartered is valued at around £40 million, while sleeve sponsor Expedia contributes an additional £12 million.
Several new partnerships were signed during the season, including Japan Airlines, Engelbert Strauss, Lucozade, and Husqvarna. Two existing partnerships were extended, most notably a 10-year renewal with Carlsberg, taking the partnership into its 42nd year.
A recent UEFA report also showed that Liverpool’s kit and merchandise revenue reached £140 million, placing them slightly behind Arsenal and Manchester United.

As the chart below illustrates, the “Big Six” remain on a distinctly higher scale for commercial revenue, although Newcastle United and Aston Villa have experienced significant growth following recent Champions League participation. Liverpool's commercial revenue is expected to rank third in the league.

Staff Costs
Staff costs comprise salaries and wages for all employees, the amortisation of transfer fees (the allocation of a player’s acquisition cost over the length of their contract), and impairment charges. Impairments arise when a player’s estimated recoverable value falls below their carrying value on the balance sheet.
Salaries and wages increased by 11%, rising from £386 million to £428 million, likely due to bonus payments linked to their Premier League success.
Amortisation remained broadly flat year-on-year and has shown little growth over the past seven years. This reflects Liverpool’s controlled investment in the playing squad, meaning they are effectively reinvesting in players at a rate roughly equal to their amortisation. Building a Championship-winning side in this manner is commendable and highlights the long-term value the club has generated from many of its squad members.


Liverpool’s salaries and wages were the highest in the league, likely boosted by bonus payments for their Championship-winning season. Amortisation was the lowest among the Big Six and only half that of Chelsea. Overall, Liverpool’s total staff costs are likely to rank third, behind Manchester City and Chelsea.

However, there will be a significant increase this season. Following a £400 million-plus investment in the squad, amortisation is expected to rise sharply, likely approaching £200 million. This will also likely have an inflationary impact on salaries, meaning Liverpool’s total staff costs are expected to rank the highest this season.
Profit on Player Sales
With a lower turnover of players than many Premier League clubs, Liverpool’s profit from player sales has traditionally been modest and not a key factor in balancing the books.
In 2024/25, profits from player sales were the highest in several seasons. The main sales were Sepp van den Berg and Fábio Carvalho, both to Brentford, which are estimated to have generated around £40 million in profit. The club also received an £8.4 million fee from Real Madrid for the early release of Trent Alexander-Arnold for the FIFA World Cup. This is assumed to have been recorded in 2024/25, bringing total player sales profits to £52 million.

Among the six clubs that have published full financial results to date, Liverpool reported the fourth-highest profit from player sales.

As mentioned, the club invested over £400 million in the squad during this summer’s transfer window. To offset this, several players were sold—including Díaz, Núñez, Quansah, Gannon-Doak, and Kelleher—likely generating around £110 million in profit, which will be recorded in this season’s accounts.
Squad Cost Ratio
The Premier League will implement a new set of financial rules from the 2026/27 season, replacing the existing Profitability and Sustainability Rules (PSR). A central metric under the new framework is the Squad Cost Ratio, which caps clubs’ on-pitch spending at 85% of football-related revenue, including net profit or loss from player sales (based on the average over the last three seasons).
This metric is broadly aligned with UEFA’s Squad Cost Ratio, which is set at a stricter 70%. As a result, clubs not competing in European competitions can invest at relatively higher levels than those, like Liverpool, already active in Europe.
The ratio considers only player and coaching staff costs while incorporating profits from player sales into revenue. Although clubs rarely report “football-only” staff costs, we estimate Liverpool's Squad Cost Ratio at approximately 60% (assuming 75% of total staff costs relate to football), well within both Premier League and UEFA limits.
Profit and Loss
Liverpool is the first club to report a profit for the 2024/25 season. In recent years, the club has been one of the most profitable in the league. Over the past ten seasons, Liverpool has recorded cumulative profits of £69 million—a rare achievement in a league where few clubs report a profit. This reflects the careful financial management of owner FSG.
Three clubs now share a similar revenue and cost profile—Liverpool, Manchester City, and Arsenal—each less reliant on owner support than the rest of the league.

In 2024/25, total revenue rose to £703 million, an increase of £89 million year-on-year, the highest in the division and a club record. Wage costs increased by £42 million and other operating expenses by £17 million. As a result, EBITDA (earnings before interest, tax, depreciation and amortisation) grew by £43 million to £103 million, making it the third highest reported this year, behind Manchester United (£183 million) and Arsenal (£142 million)
After accounting for £117 million in player amortisation and £ m14illion in depreciation, the club recorded an operating loss of £29 million. Note that across the Premier League it is rare for a club to report an operating profit.
The operating deficit was offset by £52 million from profit on player sales. Interest payments reduced to £8 million, resulting in an overall net profit of £15 million—up from the £57 million loss reported in 2023/24.
Six other clubs have published their financial results to date. Of these, only Liverpool reported a profit. West Ham recorded the largest deficit at £104 million, followed by Brighton with a £56 million loss, although both clubs had reported substantial profits in the preceding season.

Net Assets
Net assets represent the difference between total assets and total liabilities and correspond to the club’s net equity.
Assets include fixed assets—such as player registrations, facilities, and goodwill—as well as current assets like trade debtors, transfer fees receivable, and cash.
Liabilities comprise loans (from banks, shareholders, or group companies), transfer fees payable, trade creditors, deferred income (for example, advance season ticket sales), and other financial provisions.
The 2024/25 season saw a modest increase in Liverpool’s net asset base. Overall player assets, measured at net book value, declined by £20 million to £334 million. Fixed assets showed little change now that the stadium expansion is complete, standing at £312 million, with other assets of £160 million, bringing total assets to £816 million. This was partially offset by loans of £285 million, transfer fees owed of £124 million, and £124 million other liabilities, resulting in net assets of £160 million.


The table below shows the latest available net asset positions of Premier League clubs, with Liverpool's £160 million the nineth highest. It is important to note that a club’s net asset position is heavily influenced by its funding structure, particularly among challenger clubs. For instance, Aston Villa and Newcastle have benefited from significant equity injections, supporting their positive net asset positions, whereas Brighton has been primarily funded through owner debt from Tony Bloom.

There are several balance sheet–related measures within the Premier League’s new financial regulations, which come into effect next year. These fall under the Sustainability and Systemic Resilience (SSR) framework and include:
Working Capital Test
This assesses a club’s immediately available cash headroom over the course of a season. Clubs must maintain at least £12.5 million in short-term liquid assets.
Liquidity Test
This examines medium-term resilience and a club’s ability to withstand financial shocks, such as relegation. A club must demonstrate that its liquid assets, less liquid liabilities, plus 40% of squad market value, exceed £85 million. In practical terms, this reflects whether a club could cover short-term obligations by selling part of its squad if required.
Positive Equity Test
This measures long-term financial health. It includes the full squad market value (or net book value, if higher) as an adjusted asset. Total liabilities must not exceed 90% of adjusted assets, tightening to 80% by 2028/29.
Liverpool appear well positioned across these tests and maintain relatively low levels of debt. For example, their estimated Positive Equity Test ratio is around 56% (see calculation below).
The club reports total assets of £816 million. Based on Transfermarkt estimates, the squad’s market value of £842 million is £508 million higher than its book value, resulting in adjusted assets of approximately £1,324 million. With total liabilities of £656 million, this equates to 50% of adjusted assets — comfortably within Premier League limits.
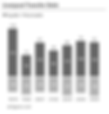
Player Trading
Prior to this season’s summer transfer window, Liverpool’s transfer spending in recent seasons had been among the lowest of the “big six”.
In 2024/25, their spending was again below that of their peers and, at £102 million, ranked only the 13th highest in the league. The major acquisitions were Giorgi Mamardashvili from Valencia and Federico Chiesa from Juventus plus Jeremie Frimpong from Bayer Leverkusen who signed just before the financial year end.
Liverpool’s £102 million investment was partly offset by £57 million in player sales, with Sepp van den Berg and Fábio Carvalho both sold to Brentford. The club also received a fee for the early release of Trent Alexander-Arnold to Real Madrid.

As mentioned, Liverpool’s player spending of £102 million is likely to rank only 13th highest in the league. In terms of net spend (acquisitions less sales), Liverpool rank 11th.

Clearly there was a change of strategy at the start of this season, with over £400 million spent on new signings, including a British-record fee for Alexander Isak alongside major additions Florian Wirtz, Hugo Ekitike, Milos Kerkez and Giovani Leoni.
The summer window also saw the departure of Díaz, Núñez, Quansah, Gannon-Doak and Kelleher, who collectively will bring in around £200 million for the club. This activity will be reflected in the 2025/26 financial statements.
Squad Cost and Net Book Value
Squad costs represent the total acquisition cost of all squad members, including transfer fees and associated costs such as agent fees. A squad’s Net Book Value (NBV) represents this acquisition cost less accumulated amortisation, with transfer fees expensed over the length of each player’s contract. For example, a player purchased for £50 million on a five-year contract would have an NBV that decreases by £10 million each year.
Liverpool have the lowest player net book value among the traditional “Big Six” clubs. This reflects their relatively modest spending on players in recent seasons (prior to this year) and the stability of the squad. As a result, their total squad acquisition cost has remained consistent over the past few years.

The cost of building Liverpool’s title-winning squad was significantly lower than that of Manchester City’s recent title-winning teams. City’s squad cost more than £1.1 billion in each of their previous four championship-winning seasons, compared with around £800 million for Liverpool.
Liverpool’s squad net book value is also far lower — roughly half that of Manchester City’s and about one-third of Chelsea’s. However, this is likely to change following their £400 million-plus investment in the squad this season.

Squad Market Value
The squad's net book value (NBV) is part of the club balance sheet, recorded as Intangible Player Assets. The NBV does not however reflect a squad’s current market value.
According to Transfermarkt.com, Liverpool's squad had an estimated market value of approximately £842 million. The difference between market value and NBV provides an indication of potential profit from player sales and a rough measure of how well a squad is holding its value relative to its accounting value.
Liverpool is in a particularly strong position on this metric. Their estimated market value is £508 million higher than their net book value, the second-largest gap in the league, behind only Arsenal. Chelsea is the only club whose squad market value is lower than its net book value, partly due to the club’s tendency to give players long contracts, although this does not fully explain the discrepancy.
The squad market value also forms part of the Sustainability and Systemic Resilience (SSR) framework, although the Premier League, have not outlined how they will measure Market Value.

Again, this picture is likely to change considerably this season, with their current market value listed on Transfermarkt.com at just over £1 billion. Their net book value, however, will also have increased significantly.
Football Net Debt
Over the last three seasons, the club has increased its debt levels, with loans from the parent company rising by £150 million over this period. They have, however, reduced their third-party debt by £20 million. These additional funds have been primarily used for the Anfield Road expansion, with the club spending £121 million on facilities over the past three years.
At the end of 2024/25, amounts owed to the parent company stood at £218 million, interest-free, while bank loans totalled £67 million, carrying an interest rate of 5.74% and repayable in 2029.

Premier League clubs’ total debt reached £3.6 billion in 2023/24, comprising £2.4 billion owed to third parties and £1.2 billion to related parties. Everton recorded the highest overall debt, although much of its related-party borrowing has since been converted into equity. Liverpool's debt ranks as the sixth highest in the league.

With Liverpool’s relatively modest activity in the transfer market, their level of transfer-related debt is lower than most of their peers. It is standard practice for clubs to structure transfer payments over multiple years.
In 2024/25, transfer fees payable totalled £123 million, while transfer fees receivable rose to £68 million. As a result, net transfer debt declined to £55 million, a reduction of £15 million compared with the previous year. By comparison, both Manchester clubs reported net transfer debt in excess of £300 million.
Amounts outstanding are expected to increase significantly this season following the club’s heavy spending (and selling) in the 2025 summer transfer window.
Cash Flow
Cash Flows are reported in three categories:
Cash Flows from Operations refer to cash generated from the club’s core activities—revenue minus day-to-day costs such as salaries, rent, and utilities.
Cash Flows from Investments include cash spent on player acquisitions and facility improvements, net of player or asset sales.
Cash Flows from Financing cover new loans or equity raised, less repayments or buybacks. If operational cash flow cannot fund investments, the shortfall is usually met through financing.
Liverpool’s cash flows highlight the club’s strong financial position. They generate robust operational cash flow, which to date has covered net transfer expenditure, although additional funding has been required to complete the Anfield Road expansion.
Looking at the last three years (as cash flows can fluctuate year on year), Liverpool generated £264 million in operating cash flow—one of the highest in the division, though well below Arsenal’s £462 million. During this period, the club invested £417 million in the squad and £125 million in facilities, while receiving £142 million from player sales.
To fund the resulting gap, external borrowings increased by £125 million, equivalent to the amount invested in facilities. While not fully financially self-sustaining, the club is arguably as close as any in the Premier League.

Reporting Entity
This analysis is based on The Liverpool Football Club and Athletic Grounds Limited, whose ultimate parent company is Fenway Sports Group, LLC, incorporated in the United States. John W. Henry is the principal owner, holding an estimated 40% of the shares, with Tom Werner holding the second-largest stake. Fenway Sports Group is a sports holding conglomerate that also owns Major League Baseball’s Boston Red Sox and the National Hockey League’s Pittsburgh Penguins.