
Premier League Financial Results 2024/25
- Matchday Finance

- Apr 24
- 26 min read
Updated: Apr 25
All twenty Premier League clubs have published their financial results for the 2024/25 season, which proved to be another record-breaking year.

This report analyses the collective financial performance of the 20 Premier League clubs based on their annual accounts. It focuses on seven key areas, examining both league-wide trends and the contribution of individual clubs.
The 2024/25 campaign, the 33rd season of the Premier League, saw Liverpool crowned champions after a dominant season, finishing 10 points clear of Arsenal in second place. Sadly, for the second consecutive year, all three promoted clubs—Leicester, Ipswich, and Southampton—were relegated.
It was also a season of significant cup successes, with Newcastle ending their long trophy drought by winning the Carabao Cup and Crystal Palace securing their first-ever major domestic honour with victory in the FA Cup. In addition, Tottenham manager Ange Postecoglou maintained his record of winning a trophy in his second season, guiding Spurs to Europa League Cup success, although their poor league form ultimately led to his departure. In the newly formatted Champions League, Arsenal was the standout English side, reaching the semi-finals before being eliminated by eventual winners Paris Saint-Germain.
Premier League Financial Summary 2024/25
Revenue continued to grow across all major streams, rising by 7.2% overall to a new record of £6.8 billion. This comes off the back of clubs investing heavily in infrastructure and their commercial operations, boosting matchday income and expanding commercial opportunities. Also, the revised formats of the Champions League and FIFA Club World Cup provided additional income for participating clubs. However, costs are rising faster than revenue. Wage bills increased by 8.6%, and other operating costs surged by a concerning 24%. Following two years of heavy transfer activity, player amortisation also rose by a further 12%. This led to record operating losses of £1.7 billion up from £1.16 billion loss the previous year.
Clubs once again turned to asset sales to offset losses and, in some cases, to remain within financial regulations. Newcastle reported a £133 million gain, largely from the sale of stadium-related leasehold improvement assets. Aston Villa generated £113 million through the sale of their women’s team and fan zone operating rights, while Everton recorded a £49 million gain primarily from the sale of their women’s team. All these transactions were conducted within their respective ownership groups.
Across the league, clubs reported a combined loss before tax of £795 million, compared to £154 million the previous season. Excluding these intra-group asset sales, total losses would have exceeded £1.1 billion—by far the highest on record.
Chelsea, having benefited from similar asset disposals in the previous two years, reported the largest loss in English football history, with a deficit of £262 million.
These losses ultimately required funding from club owners, who injected a record £1.66 billion during the season, up from £1.36 billion the year before. Encouragingly, £672 million of this investment was directed towards infrastructure, with Everton, Aston Villa, Brighton, Fulham, Manchester City and Manchester United all committing significant sums.
Consolidated Results of all 20 Clubs

Key Financial Trends


Club Mix
When comparing season-on-season results, it is important to account for changes in the composition of clubs. For 2024/25, the promoted sides—Leicester, Southampton and Ipswich—generated broadly similar revenues to the clubs they replaced (Burnley, Luton and Sheffield United) but operated with significantly higher cost bases. Key considerations include:
Total staff costs for the promoted group were £190 million higher
The promoted group made combined losses of £121 million, compared to a combined profit of £37 million for the relegated clubs
The promoted group carry debts of £250 million, against £116 million for the relegated group
Financial highlights
Premier League clubs generated a record £6.8 billion in total revenue, a 7.2% year-on-year increase.
Commercial revenue rose by 13%, with strong growth at Arsenal, Aston Villa and Newcastle, driven by new sponsorship deals, expanded fan engagement (including fan zones) and on-pitch success.
Matchday income increased by 14%, supported by higher stadium capacity (notably Liverpool and Fulham), additional European fixtures and ticket price rises.
Domestic broadcast distributions, in the final year of the current cycle, were broadly unchanged. However, UEFA distributions increased by £82 million to £407 million, reflecting the new competition format and improved performances from participating clubs.
Overall salaries and wages increased by 8.6%; however, the 17 non-relegated clubs recorded a more modest rise of 5.8%.
After three years of record transfer spending, amortisation rose by 12% and is now 36% higher than it was three years ago.
Total staff costs, before player sales, reached £6.4 billion—equivalent to 94% of revenue—with 14 clubs reporting staff cost-to-revenue ratios above 100%.
While total player sales were broadly unchanged at £1.4 billion, profits from these deals fell by £165 million to £969 million, suggesting clubs are selling players earlier in their contract cycles.
Six clubs reported a profit. Of these, Newcastle and Aston Villa relied on one-off asset sales of £133 million and £113 million respectively, while Liverpool and Bournemouth recorded the highest underlying profits at £15 million each.
Chelsea reported the largest pre-tax loss ever recorded in English football at £262 million, with Tottenham and West Ham also posting losses in excess of £100 million.
Operating losses (before player sales and asset sales) reached a record £1.7 billion, widening from £1.16 billion in the previous year.
Combined pre-tax losses totalled £795 million, compared to £154 million the prior season. Excluding intra-group asset sales, total losses would have exceeded £1.1 billion—by far the highest on record.
Net assets increased by £686 million to £4,552 million.
Total assets rose by £1.37 billion, driven primarily by increases in player registrations (+£386 million) and infrastructure investment (+£618 million).
Total liabilities increased by £684 million, mainly due to higher transfer-related payables, while borrowings remained broadly stable.
The majority of new funding was provided through equity injections, including a number of debt-to-equity conversions.
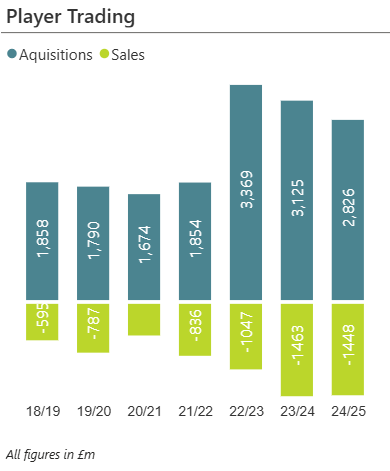
Spending on player acquisitions fell by £298 million to £2.8 billion, while income from player sales declined slightly by £15 million to £1.448 billion.
As a result, net transfer spending fell to £1.38 billion, down from £1.6 billion in the previous year.
The net book value of players increased by 7% to £5.9 billion, a level that is now 64% higher than just two seasons ago.
Total loans net of cash decreased by £550 million to £3.77 billion.
The reduction was primarily driven by debt-to-equity conversions, including Everton (£450 million), Fulham (£145 million), Bournemouth (£157 million) and Leicester (£124 million).
This was partly offset by new borrowing at Aston Villa (£76 million), Brighton (£104 million) and Manchester United (£83 million).
Net debt related to player transfers increased by £364 million to £2.2 billion.
Operating cash flows fell by £390 million to £172 million for the season, largely driven by Chelsea’s £365 million operating cash outflow.
Clubs invested £672 million in facilities, broadly in line with the previous season, alongside net player investment of £1.0 billion, down from £1.5 billion in the prior year.
A total of £1.66 billion in new funding was raised, comprising £666 million in equity and £994 million in debt.
Club Financial Summaries
Financial Outlook
Globally, the Premier League is the fourth highest revenue-generating sports league, behind only the NFL, MLB and NBA. Its international appeal continues to expand—particularly among the “Big Six”—as reflected in the rising value of overseas broadcast rights. This global reach underpins a clear commercial advantage over its European peers, with total revenue almost double that of the Bundesliga, the next largest league.
Looking at this season, revenue growth is set to continue. A new broadcast cycle is expected to increase media income by around £320 million, driven largely by further gains in international rights. With five English clubs in the Champions League and all progressing through the league phase, UEFA distributions should rise by an additional £70–100 million. Commercial revenues are also expected to maintain their recent momentum, growing by around 10%, alongside increases in matchday income. In total, league-wide revenue is projected to rise by roughly 10% to £7.5 billion.
Costs, however, will continue to climb. Staff costs are expected to increase, while player amortisation could rise by a further 10%. This will be partly offset by strong profits on player sales, with significant gains likely from deals involving players such as Isak, Mbeumo, Semenyo, Eze, Pedro and Wissa. Even so, absent any major one-off asset sales, aggregate losses are still likely to remain in the region of £600–800 million. Owner funding will therefore remain a key feature, with injections expected to exceed £1.5 billion once again.
This season also marks the final year of the current Profit and Sustainability Rules (PSR), which may constrain spending for some clubs and encourage further player sales before year-end. From next season, the new Squad Cost Ratio (SCR) will shift the focus toward revenue generation, allowing clubs to spend up to 85% of revenue on squad costs. While this incentivises commercial growth, it may also contribute to cost inflation over time. Notably, the Premier League’s new framework does not impose a cap on losses, although clubs competing in (or targeting) European competition will still need to comply with UEFA’s stricter rules, including a 70% SCR and limits on financial losses.
Whatever the financial dynamics off the pitch, the on-field product remains exceptionally strong—continuing to fill stadiums, attract a growing global audience, secure major commercial partnerships and draw increasing investment from international owners.
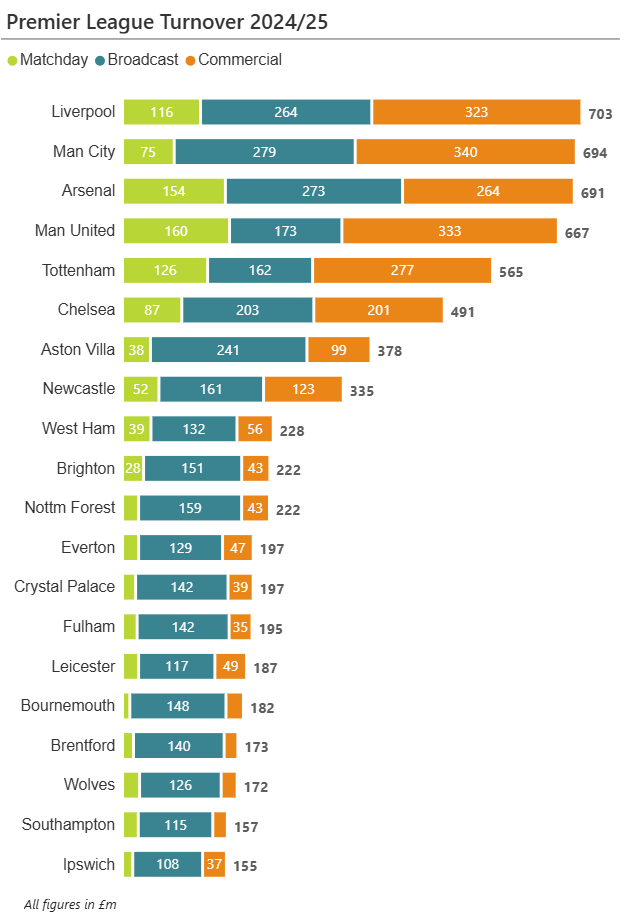
Turnover
Revenue is generated from three primary streams: matchday income (ticket sales), broadcasting distributions (from the Premier League and UEFA competitions), and commercial activities, including sponsorships, merchandising, and other business operations.
Turnover reached another record, rising 7.2% on the previous season to £6.809 billion. For non-relegated clubs, the increase was slightly lower at 6.1%. Matchday revenue grew by 13.7%, commercial revenue by 13%, and broadcast revenue by 2.2%.

Champions Liverpool recorded the highest revenue at £703 million. While the traditional “Big Six” still lead the way, Aston Villa and Newcastle have begun to close the gap on the established elite, driven by strong growth in both commercial and matchday revenue.
Matchday Revenue
Matchday revenue is driven by several factors, including the number of home fixtures, average attendance, ticket pricing, and hospitality and premium seating. Domestic cup competitions are an exception, as gate receipts are shared between the participating clubs and the FA.
Matchday revenue grew by 13.7% to a record £1.042 billion. Clubs have continued to invest heavily in their facilities to increase matchday (and commercial) income and reduce reliance on broadcast revenue. However, despite this growth, matchday revenue still accounts for only 15% of total income.
Of the overall increase, around 5% was driven by higher average attendance, 3% by an increased number of cup matches, and 5% by ticket price rises.
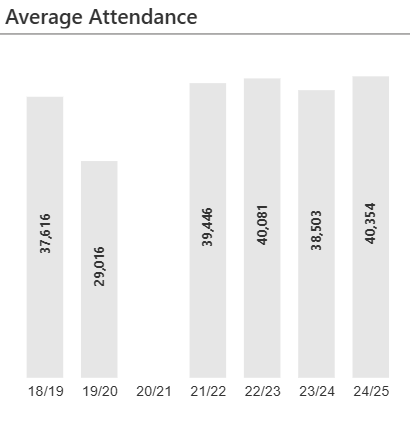
Average attendance rose from 38,503 to 40,354. This increase was primarily driven by capacity expansions at Liverpool and Fulham, as well as the fact that the newly promoted clubs recorded higher average attendances than those relegated.
Changes to UEFA’s competition formats, combined with extended cup runs for Tottenham, Manchester United, and Chelsea, increased the total number of European home matches by six. Premier League clubs also played six additional domestic cup matches compared to the previous season, although revenue from these fixtures is shared.
The combination of higher attendances and additional matches lifted the total number of paying fans by 8% to 19.56 million, equivalent to an extra 1.5 million supporters attending matches.
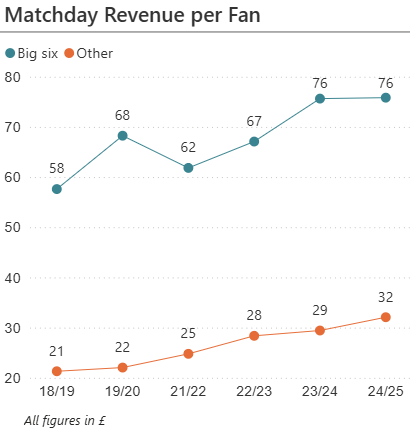
Average revenue per fan increased to £53.26 in 2024/25, up from £50.92 the previous year—an increase of 4.5%. Most clubs implemented price rises, with Nottingham Forest recording the largest increase at around 24%. The “Big Six” continue to command a significant premium in revenue per fan, averaging £75.83, while the remaining clubs generate less than half of this at £32.07.


Manchester United, Arsenal, and Tottenham all increased revenue through additional European fixtures. Liverpool benefited from their first full season with the Anfield Road expansion, which added around 7,000 seats. At the other end of the scale, Bournemouth, with a capacity of just over 11,000, generated the lowest matchday revenue.
Broadcast Revenue
Broadcast revenue is generated primarily through central Premier League distributions, UEFA payments from European competitions and the club’s own media activities.
The 2024/25 season marked the third and final year of the Premier League’s current broadcast cycle, with total distributions broadly consistent with 2023/24 levels. Approximately 67% of broadcast income is shared equally among clubs, with the remainder allocated through merit payments based on league position and facility fees linked to the number of live televised matches.
Total Premier League distributions were £2.834 billion, slightly down from £2.848 billion the previous year.

The chart below shows club-by-club distributions published by the Premier League, with each league position worth close to £3 million in merit payments.

The new formats for UEFA’s three club competitions increased UEFA's overall distributions by approximately 20%. Revenues are allocated across three components: an equal participation share, performance-based prize money, and a market value component, which is determined by the size of the TV market (with the UK being the largest) and a club coefficient based on results over the past five seasons. Roughly 75% of total revenues are distributed to Champions League participants, 15% to Europa League clubs, and 10% to Europa Conference League teams.
The new league format, with all English clubs reaching the knockout stages, increased UEFA distributions from £326 million to £407 million across the three competitions.

Arsenal’s run to the semi-finals earned them £100 million, while Aston Villa’s return to the competition, culminating in a quarter-final appearance, generated £71 million.

At the end of the season, Chelsea and Manchester City participated in the newly expanded FIFA Club World Cup, which Chelsea went on to win. The tournament is expected to generate around £85 million in prize money for Chelsea and £39 million for Manchester City. However, as it straddled the clubs’ financial year-end, only part of these earnings are recognised in 2024/25, with Chelsea reporting around £22 million and Manchester City around £30 million.
The chart below shows combined broadcast revenue for 2024/25, including Premier League distributions, UEFA payments, and FIFA Club World Cup income.

Commercial Revenue
Commercial revenue includes sponsorships, retail merchandising, tours, and other commercial activities. It is an area in which clubs have invested heavily to drive growth, including the expansion of premium seating and new fan zones such as STACK at Newcastle and the Aston Villa Warehouse. Newer stadiums such as Tottenham Hotspur Stadium now operate a year-round events calendar, hosting other sports such as NFL, boxing and rugby, as well as numerous concerts.
However, sponsorship still accounts for more than 50% of commercial income. Only a handful of clubs report sponsorship separately, but for the largest clubs this can exceed £150 million per year.
The most valuable sponsorships are for kit suppliers and front-of-shirt partners. Adidas and Nike dominate among the top clubs and together account for around 67% of kit sponsorship revenue.

In recent seasons, betting companies have dominated front-of-shirt sponsorship, with eleven clubs partnering with the industry in 2024/25. These are typically overseas firms that often do not have a physical presence in the UK. None of the “Big Six” are partnered with betting companies, meaning that, on a value basis, the sector accounts for around 25% of front-of-shirt sponsorship.
Clubs will be banned from displaying betting company names on their shirts from next season, so alternative partners will need to be sought.

Surprisingly, Chelsea did not have a front-of-shirt sponsor for 2024/25. The club had reportedly been holding out for a deal worth around £60 million per year, but this did not materialise until May 2025, when they secured a partnership with Dubai-based property developer DAMAC Properties. Several clubs benefit from ownership-linked commercial deals, including Newcastle, Manchester City, and Leicester.
On the retail and merchandise side, several clubs reported strong growth, including Newcastle with the launch of a flagship retail store. As reported by UEFA, Manchester United recorded the highest merchandise and kit sales at £146 million, followed by Arsenal and Liverpool. However, this still lags well behind the Spanish giants, with Barcelona reporting the equivalent of £235 million.
Overall, commercial revenue grew by 12% to a record £2.4 billion and is now 41% higher than just three seasons ago.

As the chart below illustrates, the “Big Six” continue to operate at a significantly higher level in terms of commercial revenue. While Newcastle and Aston Villa have narrowed the gap on Chelsea in recent years, the return of a front-of-shirt sponsor should see that gap widen again this season.

Turnover Club Summaries
Staff Costs
Staff costs comprise salaries and wages for all employees, the amortisation of transfer fees (the allocation of a player’s acquisition cost over the length of their contract), and impairment charges. Impairments arise when a player’s estimated recoverable value falls below their carrying value on the balance sheet.
Salaries and wages continued their upward trend, increasing by £351 million to £4.4 billion. £129 million of this rise is due to changes in the mix of clubs. For the 17 clubs that participated in each of the last three seasons, salaries and wages grew by 5.8%, broadly in line with revenue growth for that cohort.
Amortisation, however, has increased significantly over the past three years. With player acquisition spending reaching record levels—driven in part by Chelsea’s aggressive investment strategy—these higher costs are now flowing through in amortisation. At £2.01 billion, amortisation is now 42% higher than it was three years ago.


Chelsea reported the highest total staff costs in the division in 2024/25 at £585 million, while Manchester City recorded the highest salaries and wages at £408 million. Significant increases were seen at Brighton and Chelsea, driven by higher amortisation, and at Liverpool, partly due to title-winning bonus payments.

Comparing total staff costs before player sales profits to revenue, a remarkable 14 clubs recorded staff costs exceeding revenue, with Wolves the highest at 146%. However, Wolves’ figures cover a 13-month reporting period, which inflates costs but not revenue. Even when adjusted to a 12-month period, they would still have the highest ratio.

These high relative costs mean clubs continue to rely on player sales (or, more recently, asset sales) to reduce losses and comply with Premier League regulations.
Value for Money
Comparing total staff costs to final league position, Brentford delivered the largest positive uplift, finishing 10th despite having only the 18th highest costs. They have consistently outperformed their staff cost base, recording a positive differential in every season since returning to the Premier League in 2021/22.
Unsurprisingly, Tottenham recorded the largest negative gap, followed by Manchester United.
Profit on Player Sales
A profit is generated on a player transfer when the net proceeds (transfer fee received minus any related costs) exceed the player’s net book value, which is the original transfer fee reduced over time through amortisation. For academy graduates, whose acquisition cost is zero, the full transfer fee is recognised as profit.
Following last season’s record £1.1 billion in profit on player sales, total profits fell to £969 million. Interestingly, the total sale value of £1.45 billion was broadly unchanged from the previous season, suggesting that clubs are generating lower profits from a similar level of trading activity.
This can be driven by longer contracts offered to players (as seen in Chelsea’s case) or by clubs selling players earlier in their contract cycles. It can also occur with relegated clubs, which often invest heavily on promotion but are then forced to sell following relegation, either due to contractual clauses or the need to reduce costs.

Wolves continued their exodus of high-quality players, generating the highest profits through the sales of Kilman, Neto, Cunha, and Aït-Nouri. Manchester City ranked second, with departures including Álvarez, Cancelo, Harwood-Bellis, and Gómez. Bournemouth also moved into net selling territory, recording significant profits from the sales of Solanke, Huijsen, and Kerkez.

Squad Cost Ratio
The Premier League will implement a new set of financial rules from the 2026/27 season, replacing the existing Profitability and Sustainability Rules (PSR). A central feature of the new framework is the Squad Cost Ratio, which caps clubs’ on-pitch spending at 85% of football-related revenue, including net profit or loss from player sales (calculated as an average over the previous three seasons).
This measure is broadly aligned with UEFA’s Squad Cost Ratio, although UEFA’s limit is stricter at 70%. As a result, clubs not competing in European competitions will be able to operate at relatively higher spending levels than those, such as Liverpool, who are already active in Europe.
If the Squad Cost Ratio had been applied in 2024/25, we estimate that only four clubs would have breached the 85% limit. However, only eight clubs were below UEFA’s stricter 70% threshold. This group included five of the “Big Six” (with Chelsea significantly above the limit), Brighton (boosted by two years of very high player trading profits), and the two relegated clubs, Southampton and Ipswich.
It will be interesting to observe how the dynamics shift once the rule is introduced. For the top five clubs, the impact will be limited, as they are comfortably within UEFA’s threshold. For others, there may be scope to increase spending domestically, but this is offset by a significant constraint if they qualify for Europe. Brighton’s favourable ratio, for example, is influenced by exceptional player sale profits in 2022/23 and 2023/24, which will roll out of the calculation by 2026/27. Even Aston Villa and Newcastle, despite higher revenues, are likely to find it difficult to operate comfortably within a 70% threshold.
The likely outcome is that clubs will increasingly face UEFA fines and sanctions if they qualify for European competition, as has already been the case for clubs such as Aston Villa.
It is also unlikely to reduce the high losses incurred by clubs. For example, under the Premier League’s measure alone, Chelsea’s record £262 million loss would be compliant, as their Squad Cost Ratio sits at the 85% threshold. Assuming owners remain willing to fund continued investment, there will be an even stronger focus on revenue growth as every additional £100 of revenue allows £85 to be spent on squad costs.
As a result, we would expect increased investment in facilities (which is a positive), alongside an even greater emphasis on commercial revenue growth. However, clubs will need to be careful not to alienate loyal supporters through measures such as repeated ticket price increases.
Profit and Loss
Total losses across the Premier League in 2024/25 amounted to £795 million, a sharp increase from the £155 million loss reported the previous year.
However, the 2024/25 figures include approximately £300 million of ‘profits’ generated from clubs selling assets to other entities within their ownership groups. Three clubs accounted for these gains. Newcastle United reported a £133 million profit, largely from the sale of stadium-related leasehold improvement assets. Aston Villa generated £113 million through the sale of their women’s team and fan zone operating rights, while Everton recorded a £49 million gain from the sale of their women’s team and Goodison Park Limited. Notably, all of these transactions were conducted within their respective ownership structures.
This follows similar moves by Chelsea in prior years, including the £200 million sale of their women’s team in 2023/24 and the £70 million sale of two hotels in 2022/23.
Excluding these intra-group asset sales, total losses would have exceeded £1.1 billion—by far the highest level on record.


When comparing season-on-season results, it is important to account for changes in the composition of clubs.
The promoted sides—Leicester, Southampton and Ipswich—generated broadly similar revenues to the clubs they replaced (Burnley, Luton and Sheffield United) but operated with significantly higher cost bases. Wages were £130 million higher and other operating costs increased by a further £70 million. As a result, the three promoted clubs recorded a combined loss of £121 million, compared to a £37 million profit posted by their predecessors in 2023/24—a negative swing of £158 million.
Looking at the consolidated profit and loss for 2024/25 across all the 20 clubs, total revenue reached £6,809 million, an increase of £460 million year-on-year. Wage costs rose by £352 million, while other operating expenses increased by £386 million (up 24%). As a result, total operating costs grew by £727 million (13%), significantly outpacing the 7.2% growth in revenue. Consequently, EBITDA (earnings before interest, tax, depreciation and amortisation) fell by £267 million to £520 million, the lowest level in five years.
Player amortisation also rose sharply, increasing by 12% to £1,954 million, reflecting heavy investment in transfers over recent seasons. Player impairment increased by £47 million and depreciation by £10 million, resulting in a consolidated operating loss of £1,703 million—up £537 million on the prior year and by far the largest operating loss on record.
This operating deficit was partially offset by £969 million in profits from player sales (down £166 million year-on-year) and £302 million in one-off asset sales by Newcastle, Aston Villa, and Everton. Net interest costs increased by £39 million to £294 million, mainly due to higher notional interest on transfer-related liabilities. This led to a consolidated pre-tax loss for the 20 clubs of £795 million, a £641 million deterioration compared to the previous year’s £155 million loss.
Across the division, six clubs reported a profit, although this figure includes Newcastle and Aston Villa, whose results were boosted by intra-group asset sales. Excluding these, genuine profits were recorded by Liverpool—driven by maximum Premier League distributions, Champions League income, and increased stadium capacity—as well as Bournemouth and Crystal Palace, both of whom benefited from strong player trading profits. Relegated Ipswich also reported a profit, largely due to their very low cost base.
Chelsea recorded the largest loss in Premier League history at £262 million. Tottenham followed with a club-record loss of £104 million, driven by high interest and depreciation costs. Despite generating record profits from player sales, Wolves still reported a loss due to elevated staff costs, while Leicester’s financial struggles continued, with a £71 million loss in their relegation season.

The table below provides a further breakdown of each club’s profit metrics for 2024/25. Nine clubs reported negative EBITDA (earnings before interest, tax, depreciation and amortisation), meaning their day-to-day operating costs exceeded revenue. For these clubs, operating cash flow is also likely to be negative, implying that any net investment must be funded through external financing.
No club reported an operating profit (defined as the result before player trading, asset sales, and interest costs). At a league level, the £1.7 billion operating loss is by far the largest ever recorded, while Chelsea’s £308 million figure represents the biggest operating loss ever reported by an individual club.
Operating Expenses
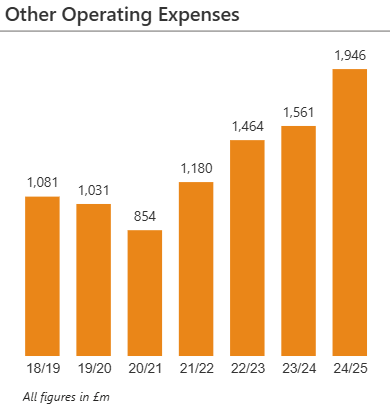
Operating expenses represent a club’s day-to-day running expenses, including energy, technology, marketing, administration, and other overheads. These figures exclude staff costs and non-cash items such as depreciation and amortisation, as well as exceptional items like profits on player sales. In 2024/25, operating costs reached £1.946 billion—a significant 24.7% increase year-on-year—and accounted for approximately 28% of total revenue, up from 21% just two years earlier.
This upward trend is largely linked to clubs’ efforts to drive revenue growth. For example, operating a year-round events calendar at venues such as Tottenham Hotspur Stadium requires substantial ongoing expenditure. Similarly, investment in expanded fan zones and entertainment offerings adds to the cost base. Additional fixtures from European competitions, the FIFA Club World Cup, and international tours further increase operational demands, while broader inflationary pressures continue to push up costs across the board.

Chelsea reported the highest operating expenses relative to turnover, reflecting a combination of lower revenue compared with the other ‘Big Six’ clubs and additional exceptional costs, including UEFA-related penalties and other legal expenses of around £50 million.
At the other end of the scale, Everton—during their final year at Goodison Park—and Bournemouth, constrained by their smaller stadium, recorded the lowest operating costs relative to turnover.
Net Assets
Net assets represent the difference between total assets and total liabilities and correspond to the club’s net equity.
Assets include fixed assets—such as player registrations, facilities, and goodwill—as well as current assets like trade debtors, transfer fees receivable, and cash.
Liabilities comprise loans (from banks, shareholders, or group companies), transfer fees payable, trade creditors, deferred income (for example, advance season ticket sales), and other financial provisions.
Total net assets have been rising steadily over the past five years, reaching £4.5 billion, up from just under £1 billion in 2020/21. This increase has been driven primarily by investment in players, with the aggregate book value of squads rising by approximately £2.5 billion over the period, alongside significant investment in infrastructure and facilities—such as Everton’s new stadium—which has added a further £2 billion.
On the liabilities side, overall debt levels have remained broadly stable. However, net transfer liabilities have increased by £1.2 billion, reflecting the growth in outstanding transfer-related payments across the league. Much of the new funding introduced into clubs has come through equity injections or debt-to-equity conversions. This does not create additional liabilities and strengthens the net asset position. As a result, total equity across the league has increased by £6.3 billion over the last five years.


At the end of 2024/25, player assets totalled £5.9 billion, while fixed assets stood at £6.2 billion. Clubs were also owed £1.25 billion in transfer fees receivable and £826 million from related parties. Adding cash reserves and other assets, total assets reached £16 billion.
These were offset by £11.4 billion in liabilities, comprising £1.4 billion in related party loans, £3 billion in third-party loans, and £3.5 billion in transfer-related payables, with the remainder made up of other liabilities and provisions.
Chelsea have the highest net assets, as the club carries no debt at football club entity level, with all recent investment funded through equity injections from the parent company. However, the parent company itself holds approximately £1.4 billion of debt.
Four clubs report a net liability position: West Ham United, reflecting a relatively low asset base as they do not own their stadium; Nottingham Forest, driven by high transfer-related and third-party debt; Brighton, where shareholder loans are a key factor; and Southampton, which also carries significant levels of debt and transfer liabilities.
There are several balance sheet–related measures within the Premier League’s new financial regulations, which come into effect next year. These fall under the Sustainability and Systemic Resilience (SSR) framework and include:
Working Capital Test
This assesses a club’s immediately available cash headroom over the course of a season. Clubs must maintain at least £12.5 million in short-term liquid assets.
Liquidity Test
This examines medium-term resilience and a club’s ability to withstand financial shocks, such as relegation. A club must demonstrate that its liquid assets, less liquid liabilities, plus 40% of squad market value, exceed £85 million. In practical terms, this reflects whether a club could cover short-term obligations by selling part of its squad if required.
Positive Equity Test
This measures long-term financial health. It includes the full squad market value (or net book value, if higher) as an adjusted asset. Total liabilities must not exceed 90% of adjusted assets, tightening to 80% by 2028/29.
These are relatively generous limits and will be affected by how the premier league determines the market value of the squad. Their methods have not yet been disclosed.
Player Trading
There has been an explosion in player trading activity over the last three seasons, driven in part by Chelsea’s strategy of acquiring numerous high-potential players on long-term contracts. Whether this model will ultimately prove successful remains to be seen, and the combination of record losses and inconsistent on-pitch performance is raising serious questions about the approach.
Chelsea are not alone, however, as many other clubs have significantly increased spending over the same period.
In 2024/25, player acquisitions fell to £2.8 billion, down from £3.1 billion the previous year. Player sales remained broadly stable at £1.44 billion, meaning net trading (acquisitions less sales) declined to £1.38 billion. This is closer to historical norms and well below the record net spend of £2.3 billion in 2022/23, of which Chelsea accounted for approximately £500 million.

After several near-£100 million transactions in the preceding two years (including Fernández, Grealish, Rice, and Caicedo), the highest-value acquisition in 2024/25 was Omar Marmoush’s move to Manchester City for an estimated £64 million. The largest sale was John Duran’s transfer to Al-Nassr for an estimated £66 million.
At club level, Manchester City were the highest spenders at £353 million, narrowly ahead of Manchester United. Notably, both totals include late-window acquisitions, with Cunha joining United and Aït-Nouri moving to City, both from Wolves. Newcastle recorded the lowest spend after two seasons of heavy investment left them more constrained under PSR regulations.
Manchester United posted the highest net spend, which was not reflected in their performance last season, though results have improved this year. Wolves recorded the highest net trading gain following a further exodus of key players.

There has been a significant increase in total transfer trading this season, with Liverpool’s major squad investment likely to lift total acquisitions to a record £4 billion, while player sales are also projected to reach around £2 billion, another record high.
Transfer Flows
The Premier League’s net spend in 2024/25 of £1.378 billion effectively represents money flowing out of the league.
So where does the £1.378 billion go? Around £400 million is estimated to be paid to agents, broadly equivalent to around 10% of total transfer fees. The FA publishes agent and intermediary fee data by club; the most recent for the period 4 February 2025 to 2 February 2026 totalling £460 million. Unsurprisingly, Chelsea were the highest spenders at £65 million, almost double Aston Villa, the next highest at £38 million. These figures cover all intermediary activity, not just transfers, so the £400 million estimate for 2024/25 specifically linked to transfers is indicative.
The remainder flows to clubs in other leagues. Based on Transfermarkt data, the Championship was the largest beneficiary in 2024/25, recording a net inflow of £270 million. Portugal ranked second with £134 million. The Saudi Pro League was the only significant net buyer from the Premier League, investing approximately £197 million in players.
Squad Cost and Net Book Value
Squad costs represent the total acquisition cost of all squad members, including transfer fees and associated costs such as agent fees. A squad’s Net Book Value (NBV) represents this acquisition cost less accumulated amortisation, with transfer fees expensed over the length of each player’s contract. For example, a player purchased for £50 million on a five-year contract would have an NBV that decreases by £10 million each year.
In simple terms, total net book value will increase if clubs spend more on player acquisitions than the combined impact of the season’s amortisation charge and the net book value of player departures (with some variation driven by changes in the club mix each year).
In 2024/25, total player acquisitions across the league were £2.8 billion, amortisation was £1.9 billion, and the net book value of player sales was £480 million. This resulted in an increase in total net book value of close to £400 million. An increase in net book value will, in turn, lead to higher amortisation charges in future years.
Net book value reached £5.9 billion in 2024/25, which is 64% higher than three seasons ago (before Chelsea’s major spending cycle began). The amortisation charge is also 42% higher than three years ago and will rise again this season.
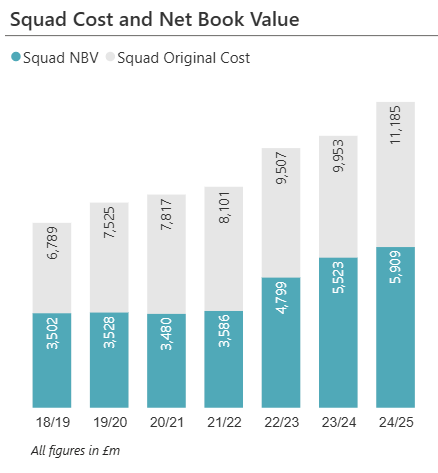
Chelsea have the highest net book value at £1.044 billion, following approximately £1.5 billion of spending over the last three seasons. This figure is further inflated by their approach of offering long-term contracts (often up to eight years), which spreads the amortisation charge over a longer period.
Their net book value is around 60% higher than the next highest club, Manchester United.

Squad Market Value
The squad’s net book value (NBV) is part of a club’s balance sheet and is recorded as intangible player assets. However, NBV does not reflect a squad’s current market value.
According to Transfermarkt.com, the Premier League as a whole has a combined squad market value of £10.7 billion, which is £4.8 billion higher than the aggregate net book value of players. This is expected, as transfer fees are typically amortised over around five years, while a player’s career span is considerably longer.
At club level, the difference between market value and net book value provides an indication of how effectively clubs are creating or preserving player value. While Transfermarkt valuations do not necessarily reflect achievable transfer fees, the uplift between market value and book value can offer a useful proxy for potential player trading profits.
At individual club level, Chelsea stand out, with their squad market value sitting close to their book value and therefore showing limited uplift. This likely reflects a combination of long-term contracts and, in some cases, high acquisition costs. It also suggests there may be limited scope to generate large future profits from player sales.
The strongest uplifts are seen at Manchester City, Arsenal, and Liverpool, with Brighton and Crystal Palace also in strong positions.

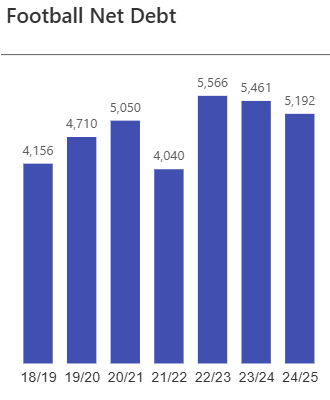
Football Net Debt
Football net debt represents the total amount owed by a club. It includes:
Loans from third parties, such as bank borrowings or other financial institutions.
Loans from owners or other related entities (for example, a parent company or directly from the owner). These 'shareholder' loans are often converted to equity at a later date.
Outstanding transfer fees owed to other clubs, net of transfer fees receivable as transfer fees are often settled over several years.
Loans
There has been a steady increase in third-party loans over the past seven years, rising in each period. In 2024/25, these loans increased from £2.9 billion to £3.07 billion, with notable rises at Manchester United, Fulham, Aston Villa, and Brentford.
In contrast, related-party loans have declined over the same seven-year period. The most significant reduction occurred in 2021/22, when Roman Abramovich’s £1.4 billion loan to Chelsea was effectively written off as part of the Clearlake/Boehly takeover.
In 2024/25, related-party loans fell by nearly £600 million overall. The main driver was the conversion of a £450 million shareholder loan at Everton into equity ahead of the takeover by the Friedkin Group. There were also significant debt-to-equity conversions at Fulham (£145 million) and Bournemouth (£157 million). Offsetting these reductions, Brighton received £100 million in new shareholder loans from Tony Bloom following two years of loan repayments.
Total debt of £4.454 billion was partially offset by £680 million in cash reserves.

Tottenham recorded the highest level of debt, driven largely by stadium financing, followed by Manchester United, reflecting the highly leveraged structure of the Glazer-era ownership. In both cases, these are long-term third-party loans.
Everton have £389 million in third-party loans, although this is significantly lower than prior to the takeover, when total debt exceeded £1 billion. Their outstanding borrowings have also been restructured into longer-term, lower-interest facilities.
Chelsea’s football entity (Chelsea FC Holdings) carries no debt, as operations have been funded through equity injections from the parent company. However, these funds are ultimately supported by external borrowing, as the ultimate parent company, 22 Holdco—which also owns Chelsea Women and Ligue 1 side RC Strasbourg—has approximately £1.4 billion in loans.

The figures above do not include loans receivable. Several clubs have outstanding balances owed from parent or other related entities, including Manchester City (£368 million), Newcastle (£191 million following their asset sale), and Aston Villa (£181 million, also after their asset sale).
Transfer Debt
With increased player trading over the past three seasons, inter-club transfer debt has risen from a net £1 billion in 2021/22 to £2.2 billion in 2024/25. In total, Premier League clubs owe £3.5 billion in transfer fees, while being owed £1.25 billion from player sales.
Transfer debts are also rising relative to transfer activity. The current amount owed is equivalent to 125% of average annual player acquisitions over the past three years. By comparison, four years ago this ratio stood at around 75%. This indicates that clubs are agreeing increasingly extended payment terms, effectively using transfer fees as a form of short-term financing.

Across the league, Manchester United had the highest gross transfer payables at £447 million, as well as the highest net position (payables less receivables) at £244 million.

Cash Flow
Cash Flows are reported in three categories:
Cash Flows from Operations refer to cash generated from the club’s core activities—revenue minus day-to-day costs such as salaries, rent, and utilities.
Cash Flows from Investments include cash spent on player acquisitions and facility improvements, net of player or asset sales.
Cash Flows from Financing cover new loans or equity raised, less repayments or buybacks. If operational cash flow cannot fund investments, the shortfall is usually met through financing.
A consolidated view of all clubs’ cash flows neatly summarises the financial dynamics of the league. Collectively, the league generated only £173 million in operational cash flow, although this was significantly impacted by Chelsea’s £355 million operating cash outflow.
Across the league, £2.56 billion was spent on player acquisitions and £676 million on facilities investment. These outflows were partially offset by £1.6 billion received from player sales.
This left a funding gap of approximately £1.4 billion, which was financed through £666 million in new equity injections and £994 million in loans. As a result, cash reserves increased by £192 million over the period.

This level of total funding, at £1.66 billion, represents another record and is now double the level seen three years ago. With ongoing investment in both players and facilities, it is unlikely to fall in the near future.
As shown in the cash flow breakdown, of the £1.66 billion in funding, approximately £670 million was directed towards infrastructure development, while around £1 billion was allocated to player trading.

Seven clubs reported negative operating cash flows, with Chelsea’s £355 million outflow having a significant impact on the overall figures. Investment activity was spread across the league, including major infrastructure projects at Manchester City, Brighton, Everton, Fulham, and Manchester United.
Equity funding was raised at six clubs, with Chelsea recording the largest injection at £339 million. In addition, loan financing increased across several clubs, including Fulham, Aston Villa, Nottingham Forest, Brighton, and both Manchester clubs. During the season, some of these loans were subsequently converted into equity, notably at Fulham (£145 million) and Bournemouth (£157 million).
Reporting Entity
This analysis is based on the following reporting entities.


Comments