
Premier League Financial Results Season 2023/24
- Matchday Finance

- Sep 17, 2025
- 22 min read
All twenty Premier League clubs have released their financial results for the 2023/24 season, which marked another record-breaking year.

The 2023/24 campaign marked the 32nd season of the Premier League and saw Manchester City claim their fourth consecutive title. It was also a notable year due to disciplinary actions: Everton and Nottingham Forest were both handed points deductions for breaching the league’s Profit and Sustainability Rules (PSR). Everton was docked eight points for two breaches, while Nottingham Forest received a four-point penalty. Despite these setbacks, both clubs avoided relegation, so it was not ultimately damaging for either side.
Globally, the Premier League ranks as the fourth-highest revenue-generating sports league, trailing only the three major US leagues—NFL (Football), MLB (Baseball), and NBA (Basketball). The league’s global appeal continues to grow, particularly among the “Big Six” clubs, demonstrated by the ever-increasing value of its international television rights.
This report analyzes the collective financial performance of Premier League clubs for the 2023/24 season, based on their annual accounts. We focus on seven key areas, examining both league-wide trends and individual club contributions to these trends. At the end of the report, we also provide a financial summary of each club.
To provide clearer insights, the analysis at times is narrowed to the clubs that remain in the Premier League. While the immediate relegation of all three promoted teams is not ideal for the league, it does help us isolate core financial trends. As this pattern is likely to repeat this season, we’ll have three years of consistent, like-for-like comparisons. This approach minimizes the impact of club mix on the overall results. For instance, clubs like Leeds United and Leicester City, relegated in 2022/23, had much larger revenue streams and cost structures compared to the promoted trio of Luton Town, Sheffield United, and Burnley.
Seasons 2023/24 Financial Summary
The 2023/24 season was another record-breaking year for the Premier League, with total turnover reaching an all-time high of £6.35 billion — a 4.6% increase compared to the previous season. The league also saw a substantial reduction in overall losses, which fell to £153 million from £713 million the year before. This turnaround was primarily driven by record profits from player sales (up 63%) and one-off income related to Chelsea’s sale of its women’s team.
Turnover - more >
Premier League clubs generated a record £6.35 billion in total revenue, representing a 4.6% year-on-year increase.
Overall commercial revenue grew by 9%, with non-relegated clubs seeing an even sharper rise of 13%.
Matchday income increased by 5.4% across the league, and by 11% when excluding relegated clubs.
Domestic broadcast distributions, currently in the middle of a negotiation cycle, rose 3%. UEFA distributions fell by 12%, reflecting a less successful European campaign for English clubs compared to the previous season.
Staff Costs - more >
Overall wage expenditure remained broadly in line with the previous season. However, non-relegated clubs saw a 7% increase in staff costs.
Amortisation increased 12.6% for non-related clubs but was flat overall as the relegated clubs had low costs relative to the clubs they replaced.
Profits from player sales surged by £440 million — a 63% increase year-on-year. This was the single largest contributor to the reduction in overall league losses.
Operating Expenses - more >
Operating expenses — covering the day-to-day running of clubs — rose by 6.5% overall, and by 11% among non-relegated clubs.
Profitability - more >
Seven clubs reported a profit for the season, with Chelsea leading the way, followed by Brighton and Manchester City.
Chelsea recorded a one-off gain of nearly £200 million from the sale of their women’s team.
Manchester United posted the largest individual loss, totaling £131 million.
Overall league losses dropped significantly to £153 million, compared to £713 million in the prior season.
Player Trading - more >
Spending on player acquisitions fell by £244 million to £3.1 billion (a 7.2% decrease), while income from player sales increased by £407 million to £1.45 billion.
As a result, net spending on player trading dropped to £1.67 billion, down from £2.3 billion the previous year.
The net book value of players rose by 14% to £5.5 billion — a figure now 50% higher than just two seasons ago.
Football Net Debt - more >
Total club loans decreased by £173 million to £4 billion partly due to several clubs converting debt into equity, offset by £517 million cash reserves.
Debt related to player transfers also fell by £124 million to £1.9 billion due to a drop in player acquisition from the previous season.
Cash Flow - more >
Operating cash flows declined by £257 million, down to £554 million for the season.
£650 million was invested in facilities led by Everton, Fulham and Liverpool and a net £1.5 billion in players.
Clubs raised £1.35 billion in new funding, primarily through equity — a similar level to the amount raised in the previous season.
It’s evident that Premier League clubs are prioritizing the growth of matchday and commercial revenues, with significant investment going into stadium infrastructure and global brand expansion — particularly by new ownership groups aiming to enhance international reach. However, rising costs remain a challenge. Several ‘challenger’ clubs were forced to navigate Profit and Sustainability Rules (PSR) compliance by actively trading players, including sales and player swap deals. This strategy was a key driver behind the league’s improved profitability but is not sustainable in the long term and may lead to a build-up of costs.
Over each of the past two seasons, sustaining the Premier League’s current level of investment in players and infrastructure has required more than £1.3 billion in new funding each season.

Seasons 2023/24 Turnover
Turnover hit a new record in season 2023/24, rising by 4.5% to £6.35 billion.

Manchester City once again reported the highest turnover in the Premier League, which at 715 million is a new league record. Arsenal saw the largest year-on-year growth, with their return to the Champions League significantly boosting all major revenue streams. European competition also drove revenue gains for Newcastle, Aston Villa, and West Ham. In contrast, Tottenham and Chelsea experienced revenue declines, largely due to their absence from European tournaments.
While overall Premier League revenue rose by 4.6%, the growth rate climbs to 6.5% when excluding the relegated clubs.

Matchday
Matchday revenue is influenced by factors such as the number of home games, average attendance, ticket prices, and the club's ability to generate income from hospitality events and corporate boxes. The only exception to this is domestic cup matches, where revenue is shared between the clubs and the FA.
Matchday revenue reached a record 909 million, up nearly 50 million from the previous year.

Champions League participation drove significant matchday revenue growth for both Arsenal and Newcastle, thanks to the addition of high-value fixtures. Aston Villa and West Ham also saw revenue increases through their involvement in European competitions. In contrast, Tottenham were the only club to report negative revenue growth, with a reduced fixture list leading to a 10% decline in paying attendance.

The growth in matchday revenue across Premier League clubs can be broadly attributed to two factors: volume (such as additional home matches or increased stadium capacity) and price (including ticket price increases and improved returns from hospitality offerings).
The table below breaks down each club’s revenue growth into these two components. For instance, Manchester United’s matchday revenue rose by just £1 million overall. However, this masked a £20 million decline due to hosting nine fewer home games, offset by £21 million in price-driven growth. Liverpool’s revenue increase highlights the impact of expanded stadium capacity as well as extra games, contributing an additional £14 million.
Key Trend The most prominent trend across the league was price-driven growth, which averaged 13% among the top 17 clubs. This wasn’t solely due to season ticket hikes—although those played a significant role—it also reflected a continued shift towards the higher value corporate and 'tourist' market and innovations such as West Ham’s ticket exchange system, which allows season ticket holders to resell seats on a per-match basis. 'Yield' is no doubt a big focus for clubs.

Matchday revenue is expected to grow further in the upcoming season, driven by several key factors: Liverpool and Fulham will benefit from a full season of increased stadium capacity, the expanded European competition format will add more high-value fixtures, and clubs are likely to continue implementing price increases.
Broadcast Revenue
Broadcast revenue is primarily derived from three sources: central distributions from the Premier League, UEFA competition payouts, and income generated through each club’s own media platforms.
With the Premier League currently in the middle of its broadcast rights cycle, central distributions saw only a modest increase, rising slightly to £2.85 billion. UEFA distributions, however, declined due to less successful performances by English clubs in European competitions. With no repeat of Manchester City’s 2022/23 Champions League triumph, total UEFA payouts fell to £347 million—down £46 million from the previous season, as anticipated.

The Premier League broadcast distribution model is the most equitable in Europe. 67% of the distributions are shared equally among all clubs, with the remainder allocated based on league position (merit payments) and the number of televised live games (facility fees). Each league position adds an additional £2.8 million, and each live game generates around £900k.
Distributions by club for season 2023/24 as reported by the Premier League:

Premier League distributions for this season are expected to be similar to those in 2023/24, as it marks the final year of the current three-year broadcast cycle. However, there will be a significant increase of around £400 million for the 2025/26 season, driven by a 23% rise in international broadcast rights.
UEFA also uses a central distribution model for its payments, which are determined by several factors. All clubs receive a base participation fee of €15.64 million. Additional prize money is awarded for wins and draws in the group stage, as well as for advancing through the knockout rounds. Further payments are based on a club’s coefficient, which reflects its performance in European competitions over the past five seasons. Additionally, there is a TV pool allocation, which varies depending on the size of the country’s market and the club’s coefficient. As a result, clubs with consistent European involvement tend to earn more.
UEFA distributions to Premier League club for season 2023/24 are:

UEFA distribution are expected to grow this season due to the new league format. It will grow again in season 2025/26 as the premier league has five Champions League and eight European spots overall.
Commercial Revenue
Commercial revenue, encompassing sponsorships, retail merchandise, tours, and other activities, totaled £2.15 billion in the 2023/24 season, marking a 9% increase compared to the previous year.

Key Trend Commercial revenue is a key focus for many clubs as they aim to reduce their reliance on broadcast revenue. Several clubs saw significant increases, with non-relegated teams collectively recording a 12% rise in commercial income.
Arsenal had the biggest increase, capitalizing on their return to the Champions League, while Newcastle also saw growth through a new front-of-shirt sponsorship. Nottingham Forest experienced notable growth thanks to new sponsorship and kit deals. Liverpool surpassed Manchester United to become the second-highest in commercial revenue, bolstered by new partner agreements. A recent UEFA report also highlighted that Liverpool had the highest kit and merchandise revenue in the Premier League and the fourth-highest in Europe.
Commercial revenue remains a key differentiator between the "Big 6" and the rest of the league. For example, despite having the lowest commercial income among the Big 6, Arsenal still generates 2.5 times more than the next highest club, Newcastle.
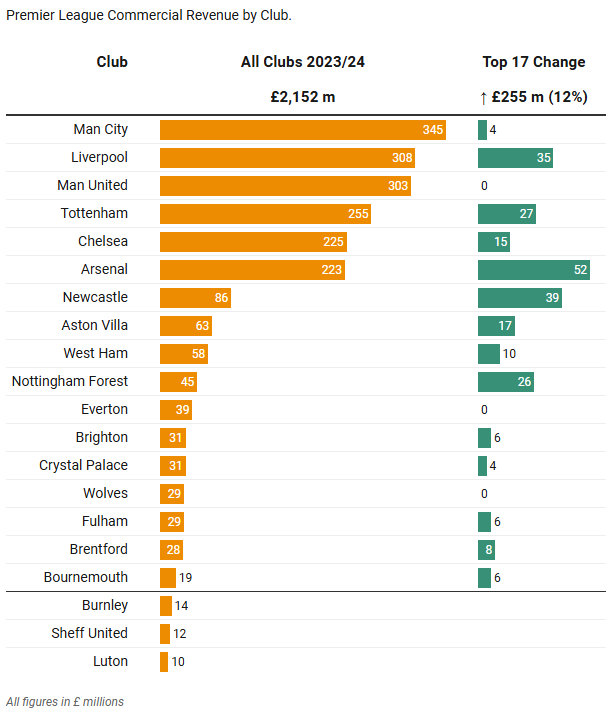
Sponsorship income typically accounts for over 50% of a club’s commercial revenue, with shirt sponsorship being a particularly lucrative source for Premier League teams. For the Big 6 clubs, these deals can be worth as much as £60 million per year, while mid-sized clubs generally see around £10 million annually. Thirteen mid-sized clubs have partnered with the betting industry in some form, with seven having a betting company as their front-of-shirt sponsor. However, these deals will expire after next season, as betting companies will be banned from displaying their names or logos on club shirts. It will be interesting to see how this affects commercial revenue moving forward. Notably, none of the Big 6 clubs currently have betting companies as their shirt sponsors.
Season 2023/24 Staff Costs
Staff costs include club salaries and wages, amortization, impairment and profit from players sales.
Salaries and Wages
Salaries and wages cover all club employees, with the largest portion the players and management. While clubs don’t provide a detailed breakdown, it is generally estimated that player and management salaries account for around 80% of the total salaries and wages.
For the first time in several seasons, there was no increase in Premier League club's salaries and wages. The total for the 2023/24 season was £4.049 billion, from £4.051 billion the previous year.

However, the promoted (and since relegated) clubs had much lower salary bases compared to the teams they replaced. For instance, Leicester and Leeds had significantly higher salary costs than Luton and Sheffield United. Therefore, when excluding the relegated clubs, total salaries for the remaining 17 Premier League teams amounted to £3.83 billion, which is a 6.7% increase on the previous year.
Clubs with European participation, such as Arsenal, Aston Villa, and Newcastle, saw significant salary increases. Manchester City had the highest salary costs, while Brentford had the lowest. Tottenham and Chelsea experienced salary declines, as neither club participated in European competitions.

Amortization and Impairment
Amortization is the write-down of a player’s acquisition cost over the duration of their contract. Typically, this period lasts five years, though some clubs, like Chelsea, sign players to longer contracts, sometimes extending up to eight years. Impairment occurs when a player's market value is considered lower than their current book value. Impairment costs are usually irregular and small in comparison to amortization.
In the 2023/24 season, amortization increased by only 1.6%, totaling £1.75 billion. Impairment costs were significantly lower, standing at just £8 million compared to £59 million in the previous season.

However, similar to salaries and wages, if relegated clubs are excluded, amortization actually increased by 12%. This rise is primarily due to the significant player acquisitions made by several clubs over the past two seasons, with Manchester United, Arsenal, Tottenham, Nottingham Forest, and Bournemouth all having big increases.
As expected, Chelsea reported the highest amortization, following their spending of over £1 billion in the last two seasons. This figure would have been even higher if not for the long-term contracts they negotiated with certain players, some of which extend up to eight years, allowing the costs to be spread over a longer period.
It's important to note that for Profit and Sustainability Rules, the amortization write-down is capped at five years. As a result, Chelsea's amortization figure would be recalculated based on this five-year limit, significantly increasing their reported amount.

We anticipate that amortization will continue to rise next year, as the net book value of players (acquisition costs minus the amount already amortized) has increased significantly over the past two seasons. A higher net book value results in more amortization that needs to be written off in future years.
Key Trend: As shown below, the total player net book value has grown by 50% over the last two seasons. This is a concerning trend, as it represents a build-up of costs that will need to be amortized in the coming years.

Staff Costs as a Percentage of Turnover
Staff costs as a percentage of turnover is an important metric, particularly when viewed before profit from player sales. It helps assess the sustainability of a club’s salary and amortization expenses. A high ratio indicates that a club may need to sell players to comply with Profit and Sustainability Rules (PSR).
This ratio has been decreasing in recent years, which is a positive sign for the league.

However, seven clubs have a staff cost-to-turnover ratio exceeding 100%. These include clubs that are now challenging the Big 6, such as Aston Villa and Nottingham Forest this season, as well as clubs facing legacy financial challenges, like Everton and Wolves.
While Chelsea is an exception, it's worth noting that the other Big 6 clubs have lower ratios, primarily due to their higher turnover.

Profit on Player Sales
When a player is sold, the selling club records the difference between the sale price and the player’s current net book value as profit on player sales. For example, if a player is bought for £10 million on a five-year contract (amortized at £2 million per year) and sold for £7 million three years later, the recorded profit is £3 million. This is because the player’s net book value after three years is £4 million (£10 million minus three years of £2 million amortization).
There has been a significant increase in profit from player sales over the last two seasons. Many clubs are relying on this (or being forced to) to generate immediate profits in order to stay within Profit and Sustainability Rules (PSR). Several clubs, including Newcastle, Aston Villa, and Everton, have sold players or engaged in player swaps just before their financial year-end to boost profits. This strategy is particularly beneficial with academy players, who have a zero book value, meaning any transfer income is recorded as pure profit. Many clubs now view profitable player trading as a core part of their overall strategy.
Key Trend: Profit from player sales has surged to £1.13 billion, a remarkable 63% increase from £694 million the previous season. This highlights the growing importance of player sales as a tool for clubs to comply with PSR, and it has been the single biggest factor in the Premier League's reduction in overall losses.

In season 2023/24 Chelsea led the way as they had a large turnover of players (both in and out). Manchester City also had high sales with a number of academy players leaving (a strategy they may now question) and Brighton again made significant profits on several players.
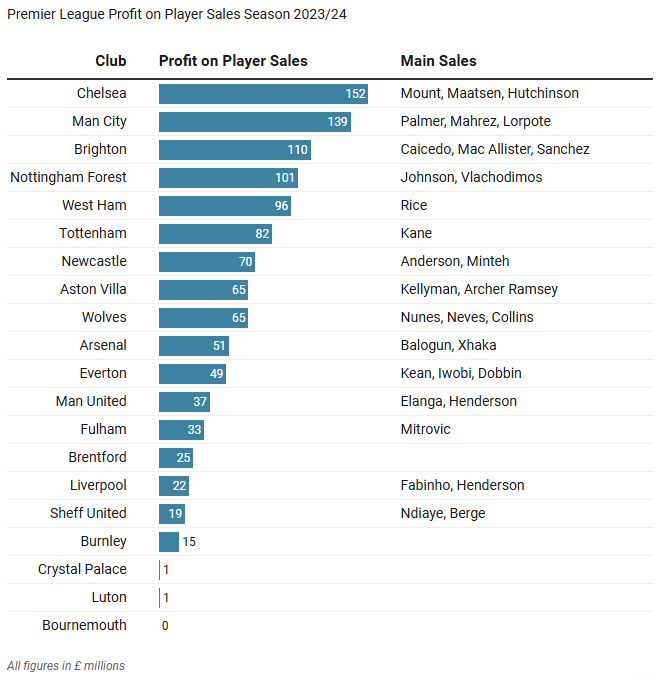
This trend has continued into 2024/25 as there has been a similar level of player sales.
Season 2023/24 Operating Costs
Operating costs represent the club’s day-to-day running expenses, including energy, technology, marketing, administration, and other similar costs. These figures exclude non-cash items such as depreciation and amortization and also exclude exceptional items such as profit on player sales. In the 2023/24 season, operating costs reached £1.57 billion — a 7.1% increase from the previous year — and accounted for approximately 25% of total revenue.

Excluding relegated clubs, operating costs rose by 9.8%. Manchester City reported the highest operating costs overall, while clubs newly participating in European competitions — such as Arsenal and Newcastle — also saw significant increases, largely due to the additional expenses associated with extra fixtures.
Key Trend: Several clubs attributed rising costs to efforts supporting commercial growth, including new retail outlets (as seen with Liverpool), international tours (like Brighton’s trip to Japan), and expanded marketing efforts aimed at strengthening their global presence.
Conversely, Manchester United recorded the largest decrease in operating costs, reflecting cost-cutting measures introduced by Jim Ratcliffe. Tottenham also saw a decline, attributed to a reduced number of hosted matches, while Everton and Wolves kept costs down due to ongoing financial constraints.

Season 2023/24 Profit and Loss
The overall loss for the 2023/24 season dropped significantly to £153 million, down from £713 million in 2022/23 — marking the smallest loss in recent years. Other key profit metrics also showed improvement. EBITDA (earnings before interest, taxation, depreciation, and amortisation), often used as a proxy for cash flow, rose by £162 million to reach £788 million. Operating profit, which excludes exceptional items such as player sale profits and other one-off income or costs, improved to -£1,162 million from -£1,349 million the previous year.

These figures appear encouraging. However, three key factors are driving the improved results:
One-off gains by Chelsea – Chelsea reported a one-time profit of nearly £200 million from the sale of their women’s team, following a £76 million gain from property sales in the previous season.
Surge in player trading profits – Profits from player sales rose by £400 million, a 60% increase year-on-year. This was the single largest factor contributing to the overall reduction in league losses.
Improved financial performance from promoted clubs – The newly promoted clubs — Luton, Burnley, and Sheffield United — delivered significantly better financial results than the previous season’s relegated sides (Leicester, Leeds, and Southampton), contributing to a £230 million turnaround in profit before tax.
The financial data presented below represents a consolidation of the profit and loss accounts for the 20 Premier League clubs in each respective season.

Profitability excluding Relegated Clubs
Excluding the relegated clubs the financial picture is different. Although turnover rose by 7%, salaries and wages also increased by 7%, and operating expenses grew by 11%. As a result, EBITDA fell from £714 million to £671 million.
Additionally, with player amortization up by 9%, operating profit (defined as profit before exceptional items and interest) declined to -£1,200 million, down from -£1,012 million the previous season. This metric is significant, as it highlights the extent to which clubs rely on player trading profits to reduce their overall losses.
The Profit on Asset Sales figure is Chelsea’s sale of their women’s team in 2023/24 and the sale of hotel assets in 2022/23. It's surprising that these transactions are permitted under Premier League Profit and Sustainability Rules (PSR), despite Chelsea selling to their own parent company, BlueCo 22 Limited — a business that has itself reported losses of £1 billion over the past two years. Questions also remain over whether the £200 million valuation of the Women's club represents fair market value.
There was also a £116 million swing in exceptional items. Manchester United incurred close to £50 million in restructuring costs, while the previous year saw Bournemouth report a £70 million gain from a loan write-off.
Lastly, net interest costs increased by £69 million, with Manchester United alone accounting for a £20 million rise. Several clubs also reported increased interest expenses due to higher levels of player trading debt.

.
Looking at the key profitability measures by club, unsurprisingly Chelsea recorded the highest profit after their Women's team sale. Brighton, Manchester City and West Ham also recording strong profits, although these were the result of high profits on player sales. The biggest loss was Manchester United, although they did incur significant one-off restructuring costs with Jim Ratcliffe's program of cost cutting. Big losses also for Aston Villa and Bournemouth due to high staff costs relative to turnover.
Six clubs had negative EBITDA (including Chelsea) as these clubs salaries and day-to-day operating costs are greater than revenue. The only clubs to report a positive operating profit were two of the relegated clubs, Luton and Sheffield United, which suggests these clubs took a very conservative approach to their time in the premier league. You could argue Luton performed well with their limited financial budget,

It is hard to predict profitability for this season, but we would expect a slightly higher revenue growth with additional income from the new UEFA league formats and slightly increased overall stadium capacity. Costs we expect to increase at similar levels to 2023/24 and profit from player sales to also be similar to 2023/24. Assuming there are no further exceptional items, the overall loss is likely to be higher and in the region of 350 to 550 million.
Profit and Sustainability Rules
Earlier this year, the Premier League confirmed that no clubs would face sanctions based on their financial results for the 2023/24 season. This came as welcome news for the league, especially after the turmoil sparked by Everton’s points deduction—and to a lesser extent, Nottingham Forest’s.
That said, it must have been a close call for several clubs. Teams like Newcastle, Everton, and Aston Villa made late-season player sales to generate profits, while Chelsea relied on the controversial sale of their women's team. Recently promoted sides such as Bournemouth and Fulham also posted significant losses, so they were probably close to their allowable limits which were lower than other clubs due to time in the championship.
Season 2023/24 Player Trading
Player trading has surged significantly over the past two seasons. In 2022/23, spending on player acquisitions soared to a record £3.3 billion—up from £1.8 billion the previous season. That trend continued into 2023/24, with clubs investing another £3.1 billion in players. A major contributor to this spending spike was Chelsea, who spent an incredible £745 million and £553 million in those two seasons respectively.
Key Trend: The 2023/24 season saw a sharp rise in player sales, with clubs generating a record £1.45 billion—£400 million more than the year before. This increase was partly driven by the need to comply with Profit and Sustainability Rules (PSR), prompting clubs to sell players at a profit. Additionally, there was a noticeable uptick in intra-league trading, including a number of controversial player swap deals.

As a result, net player trading—calculated as player acquisitions minus player disposals—fell from £2.3 billion in 2022/23 to £1.67 billion in 2023/24. It's important to note that this figure represents cash flowing out of the Premier League, which must be funded either through clubs' operating cash flow or by securing new financing.

It’s no surprise to see Chelsea leading the way in both net spend and total player acquisitions, with Arsenal, Manchester United, and Tottenham also recording significant outlays. Bournemouth continued to invest strongly, with minimal player departures. On the other hand, Brighton once again generated substantial income through player sales, while clubs like Everton and Wolves were more limited in their activity due to financial constraints.

This season, player acquisitions and disposals have remained broadly in line with 2023/24 levels, though the clubs driving the spending have shifted. Notably, Brighton—previously a consistent net seller—has been a major net spender. Manchester City has also ramped up its spending, in part responding to a relatively poor start to the campaign. Tottenham, West Ham, and newly promoted Ipswich have likewise been among the biggest net spenders.
Squad Cost and Player Net Book Value
Squad Cost is the total acquisition cost of the current playing squad. This includes transfer fees and intermediary expenses like agent fees. It covers all players, even if their costs have been fully amortized, but excludes homegrown academy players, as their acquisition cost is zero.
Player Net Book Value is the squad costs less accumulated amortization. For example, if a player was bought for £10 million on a five-year contract, their net book value after two years would be £6 million—reflecting two years of amortization at £2 million per year.
Significant player acquisitions over the past two seasons have led to a sharp rise in both squad cost and net book value. While a higher squad cost shows the scale of a club’s investment-which is interesting, net book value represents future amortization costs that will impact profitability in the coming years.
Key Trend: As shown below, player net book value has grown by 53% over the last two seasons, meaning an inevitable increase in amortization over the next couple of years.

Unsurprisingly, Chelsea again tops both the squad cost and player net book value rankings, after over £1 billion invested in the last two seasons. Remarkably, their net book value is nearly double that of the next highest club, Manchester City. This is also driven by the lengthy contracts signed with key players, which spread the cost over more years but also increase future amortization expenses. Additionally, these long-term deals may limit profits on player sales if those players are transferred.
In contrast, clubs like Everton and Wolves have seen a reduction in book value. Financial constraints have forced both clubs to offload several players, lowering their overall squad investment.

Season 2023/24 Football Net Debt
Football Net Debt covers traditional borrowings such as bank loans (offset by cash reserves), as well as loans provided by club owners or affiliated entities like parent companies. It also includes outstanding payments owed to other clubs for player transfers.
Loans
Total loans, net of cash on hand, stood at £3.5 billion at the end of the 2023/24 season. This remains below the peak seen in 2020/21 and is a similar level to the previous year. Note, the 2020/21 peak included a £1.3 billion loan from Roman Abramovich to Chelsea, which was later written off following the club’s sale.
Bank and other financial institution loans have steadily increased over the past six years, reaching £2.3 billion. A significant contributor to this rise has been Everton’s use of debt to help finance the construction of their new stadium.
In contrast, related party loans—which include loans from shareholders and related companies—fell to £1.2 billion from £1.5 billion the year before. This decline was partly driven by Leicester City's relegation to the Championship and repayments made by Brighton to their owner, Tony Bloom.

Related party loans are often interest-free and lack defined repayment terms. An example is Tony Bloom’s investment in Brighton, where he has provided up to £400 million without charging interest or setting a repayment schedule. This type of funding was highlighted in Manchester City’s case concerning related party transactions. The argument made was that interest-free loans provide a financial advantage, as they are not reflective of market terms. As a result, there may be future requirements for clubs to apply a notional interest rate to such loans, aligning them more closely with fair market value.
It’s also common for club owners to convert shareholder loans into equity, effectively removing the debt from the balance sheet. This approach has been used by Everton (subsequent to the reporting period), Fulham, Nottingham Forest and Brighton during the early years of Tony Bloom’s ownership.
By the end of the 2023/24 season, Everton had the highest level of total debt—exceeding £1 billion—driven by both the financing of their new stadium and funding continued operating losses. Tottenham also reported significant debt due from their new stadium, while Manchester United’s debt burden remains largely tied to the Glazers’ leveraged buyout.

This season, Everton's £447 million shareholder loan from former owner Farhad Moshiri was converted into equity ahead of the club’s takeover by the Friedkin Group.
Player Trading Debt
It is common for player transfer fees to be paid in instalments over several years, effectively serving as a form of financing for clubs. With the sharp rise in player trading over the past two seasons, it’s unsurprising that these balances have grown significantly.
By the end of the 2023/24 season, the total amount owed by Premier League clubs to other clubs for player transfers reached £3.18 billion—an increase of £200 million from the previous year. Meanwhile, the amount receivable also rose, from £950 million in 2022/23 to £1.28 billion.
Key Trend: The £3.18 billion payable represents just over one full season’s worth of transfer spending, marking a record high. This indicates that clubs are increasingly negotiating extended payment terms when acquiring players.

Tottenham have the highest net transfer fees payable at £272 million, whilst Chelsea has the highest payable amount of £453 million.

Of the total net player transfer debt of £1.90 billion, £933 million is due for payment or receipt in the current season (classified as current debt). This figure does not account for any acquisitions or sales made this season, which could impose a significant cash flow strain on several clubs.
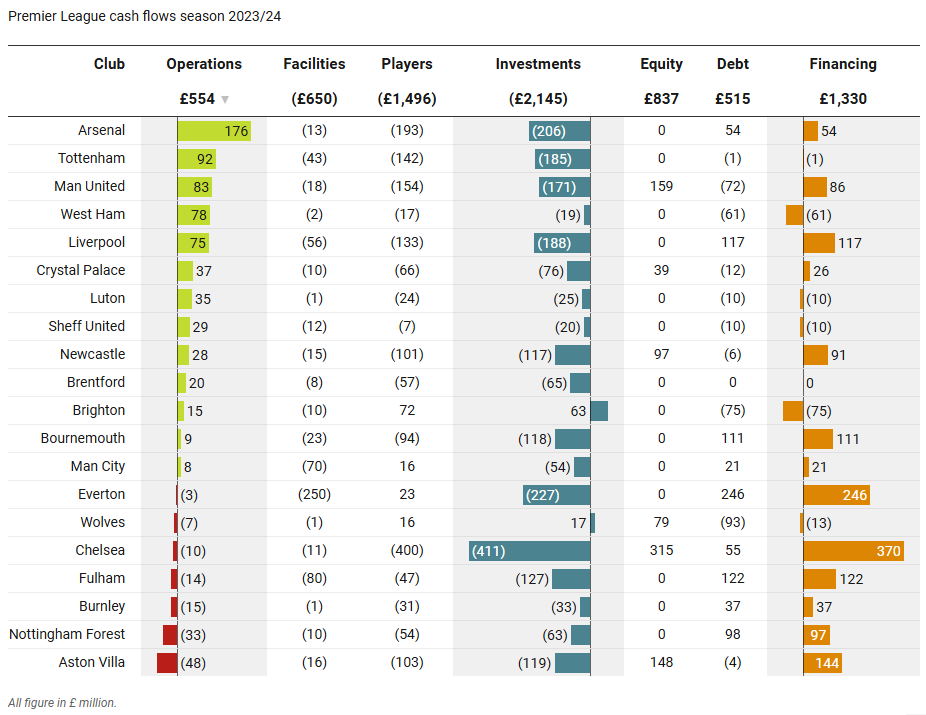
Season 2023/24 Cash Flow
Cash flow is vital for any business, and Premier League clubs are no exception. It is generally divided into three areas:
Cash Flows from Operations. This refers to the cash generated by the core operations of the club, effectively the revenue minus day-to-day operational costs such as salaries, wages, rent, utilities, etc. It excludes non-cash expenses like depreciation and amortization and is calculated before any investment or financing activities.
Cash Flows from Investments. This includes cash flows from investment activities such as player acquisitions and facility improvements, net of any player or asset sales. It represents actual cash movements. For example, if a club buys a player for £10 million, the payment might be spread over four years, meaning the cash flow would be £2.5 million per year.
Cash Flows from Financing. This covers new loans or equity raised, minus any loan repayments or share buybacks (which are rare). Essentially, if cash flow from operations doesn’t cover the cash flow required for investments, additional financing is needed.
Key Trend: As shown below, cash flow from operations isn’t sufficient to cover investments in facilities and players, which means new funding is required. Over the last two seasons, more than £1.3 billion in new funding has been needed to support Premier League clubs.
In the 2023/24 season, cash flow from operations was £554 million. However, £650 million was spent on facilities and £1.5 billion on players, resulting in a shortfall of £1.6 billion. This gap was funded through the issuance of £837 million in equity, an additional £515 million in debt, and the remainder from cash reserves.

Operating cash flows can fluctuate year on year due to factors such as supplier payment terms, the timing of prepaid season tickets, and other deferred income and expenses. In the 2023/24 season, Arsenal generated the highest operating cash flows, nearly double that of Tottenham, who had the second-highest. Seven clubs, including Chelsea, reported negative cash flows, reflecting their high operating costs relative to revenue.
Everton was the largest investor in facilities, while Chelsea made the biggest investments in players. Seven clubs raised new equity, with Chelsea, Manchester United, and Aston Villa leading the way, while Everton raised the most debt.
Brighton and Wolves were the only clubs with positive cash flows from investments, primarily due to significant player sales. This enabled Brighton to repay a portion of its debt to owner Tony Bloom.
With player trading remaining at similar levels in the 2023/24 season, coupled with high player trading debt, we anticipate that a similar amount of new funding will be needed this season.
Club Financial Summaries
Click the club name to access their detailed report


Comments