


Premier League
Financial Results 2024/25
Summary
On Pitch
Turnover
Staff
Profit
Assets
Trading
Debt
Cash
Info.
Summary
On Pitch
Turnover
Staff
Profit
Assets
Trading
Debt
Cash
Info.
Summary
Clubs are required to publish their financial statements within nine months of their year-end (for example, by 30 March 2026 for a 30 June 2025 year-end).


On Pitch Performance

Turnover
Turnover includes income derived from the club’s main operations, excluding player transfer income. The key sources include:
-
Matchday income (ticket sales),
-
Broadcast income (from central distributions from the Premier League, UEFA payments for participation in European tournaments, FIFA payments for participations in the Club World Cup and income generated through the club’s media platform).
-
Commercial income (such as sponsorships, merchandising, and other business activities).


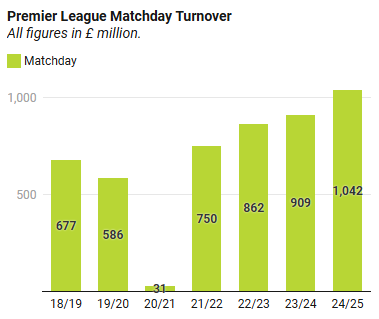
Turnover - Matchday
Matchday revenue is influenced by factors such as the number of home games, average attendance, ticket prices, and the club's ability to generate income from hospitality events and corporate boxes. The only exception to this is domestic cup matches, where revenue is shared between the clubs and the FA.

Turnover - Broadcast
Broadcast revenue comes from central distributions from the Premier League, UEFA payments for participation in European tournaments, FIFA payments for participations in the Club World Cup and income generated through the club’s media platform.
Of the Premier League distributions, 67% is evenly distributed among all clubs, with the remainder based on league position (merit payments) and the number of televised live games (facility fees). For more information check out our blog Premier League Broadcast Distribution for Season 2023/24.


UEFA Revenues are allocated through three pillars: an equal participation share, prize money based on performance, and a value component derived from the size of the TV market (with the UK being the largest) and a club coefficient reflecting results over the past five seasons. Approximately 75% of revenues are distributed to Champions League's participants, 15% to the Europa League and 10% to the Europa Conference League.

The newly formatted FIFA Club World Cup provides substantial income for participating clubs. Revenue is distributed through two main pillars. The first is a participation pillar, under which European clubs receive a fee based on their sporting and commercial ranking, ranging from approximately USD 13 million to USD 38 million. The second is a performance pillar, with additional income awarded as clubs progress through the tournament, with the winner earning USD 40 million.
The tournament spanned the financial year-end of England’s participating clubs; therefore, income from the 2025 tournament will be split across financial years.
Total broadcast income, consolidating distributions from the Premier League, UEFA payments, the FIFA Club World Cup, and the club’s own media platforms. All figures are estimates.


Turnover - Commercial
Commercial revenue includes sponsorships, retail merchandising, tours, and other commercial activities.
Premier League clubs will be banned from displaying betting company logos and names on the front of shirts starting in the 2026/27 season.


Turnover - Club Summaries
Staff Costs
Total staff costs include:
-
Salaries and wages paid to all employees,
-
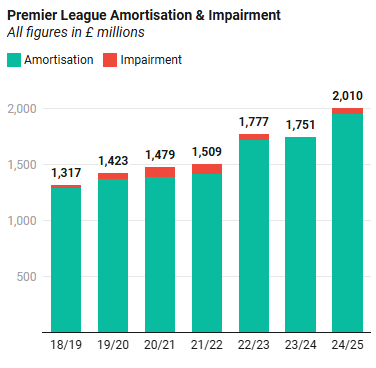
Amortisation of transfer fees (spreading the cost of a player’s acquisition costs over the length of their contract),
-
Impairments incurred when a player’s estimated current market value falls below their book value.
Total staff costs are offset by profits earned from player sales.

Staff costs as a percentage of turnover is a key indicator of a club’s financial sustainability. This ratio reflects how likely a club is to rely on player sales to reduce losses and comply with profit and sustainability regulations. A high ratio increases the risk of significant losses if player sales do not generate sufficient profit. UEFA’s Financial Sustainability Regulations include an adjusted ‘squad cost ratio’, and the Premier League is also set to trial a similar measure in the 2026/27 season.

Profit from Player Sales
A profit is generated on a player transfer when the net proceeds (transfer fee received minus any related costs) exceed the player’s net book value — the original transfer fee gradually reduced through amortisation. For academy graduates, whose acquisition cost is zero, the full transfer fee is recognised as profit.

Staff Costs - Club Summaries

Profit and Loss
The key measures of profitability are:
-
EBITDA (Earnings Before Interest, Tax, Depreciation, and Amortisation) is calculated as total revenue minus the club’s regular operating expenses and typically reflects the cash flows generated by the club.
-
Operating Profit is derived from EBITDA after accounting for non-cash expenses, including depreciation of fixed assets and amortisation of player transfer fees.
-
Profit Before Tax is total revenue less all costs excluding company tax.
-
Profit and Loss - 2023/24
Assets and Liabilities
Net assets represent the difference between total assets and total liabilities and correspond to the club’s net equity.
-
Assets include fixed assets—such as player registrations, facilities, and goodwill—as well as current assets like trade debtors, transfer fees receivable, and cash.
-
Liabilities comprise loans (from banks, shareholders, or group companies), transfer fees payable, trade creditors, deferred income (for example, advance season ticket sales), and other financial provisions.
Some clubs have negative equity, which technically means they do not have sufficient assets to cover their debts. However, this is often the result of shareholder loans, which are commonly later converted into equity.
Net Assets - 2023/24
Player Trading
Net player trading is the difference between player acquisition costs and income from player sales. Acquisition costs include transfer fees, agent commissions, and intermediary expenses.
Net Book Value is the total acquisition cost less accumulated amortisation (the write down of the player’s acquisition costs over the length of their contract) and reflects the remaining book value of the squad based. A higher Net Book Value means higher amortisations costs in future years. Total Squad Cost is the total original acquisition cost of the current squad.
Market Value is the aggregate market value of the squad as estimated by transfermarkt.com at the end of season 2024/25. Value add is the difference between market value and net book value.
Squad Costs
Squad Market Value

Football Debt
Football net debt represents the total amount owed by a club. It includes:
-
Loans from third parties, such as bank borrowings or other financial institutions.
-
Loans from owners or other related entities (for example, a parent company or directly from the owner). These 'shareholder' loans are often converted to equity at a later date.
-
Outstanding transfer fees owed to other clubs, net of transfer fees receivable as transfer fees are often settled over several years.
Loans
Transfer Debt
Football Debt - 2023/24
Cash Flow
Cash Flows are reported in three categories:
-
Cash Flows from Operations refer to cash generated from the club’s core activities—revenue minus day-to-day costs such as salaries, rent, and utilities. It excludes non-cash expenses like depreciation and amortisation and is measured before investment or financing activity.
-
Cash Flows from Investments include cash spent on player acquisitions and facility improvements, net of player or asset sales. It reflects actual cash movements—for example, a £10 million transfer paid over four years would result in £2.5 million per year.
-
Cash Flows from Financing cover new loans or equity raised, less repayments or buybacks. If operational cash flow cannot fund investments, the shortfall is usually met through financing.
Cash Flow - 2023/24

Information
Football clubs often operate through multiple legal entities. For example, day-to-day football operations may sit in one entity, while the stadium and other assets are held in another. The women’s team is also frequently structured as a separate entity.
Where applicable, this report refers to the entity that controls the football club, its facilities, and typically the women’s team. The table below lists each club’s reporting entity, links to their published accounts, and the reporting period—normally 12 months but occasionally different.
Clubs are required to publish their financial statements within nine months of their year end (for example, by 30 March 2025 for a 30 June 2024 year end). Most release results around this deadline, with a few exceptions such as Manchester United, which reports in September due to its U.S. listing, and Manchester City, which publishes in December.


