
Chelsea Financial Report
- Matchday Finance

- Mar 30
- 4 min read
Chelsea's latest financial results cover the period from 1 July 2024 to 30 June 2025 for entity Chelsea FC Holdings Limited (company number 02536231).
This analysis presents the club’s financial results across eight reports, including financial data and key performance statistics:
Financial Summary
Turnover
Staff Costs
Profit and Loss
Net Assets
Player Trading
Football Net Debt
Cash Flow
Each report includes six years of historical data and can be exported to Excel using the “Get the data” option at the bottom of each report.
For a detailed analysis of the latest results see this blog Brentford Financial Results 2024/25.
Performance
24/25 | 23/24 | 22/23 | 21/22 | 20/21 | 19/20 | 18/19 | |
League | 4th | 6th | 12th | 3rd | 4th | 4th | 3rd |
FA Cup | Rd 4 | SF | Rd 3 | RU | RU | RU | Rd 5 |
League Cup | Rd 4 | RU | Rd 3 | RU | Rd 4 | Rd 4 | RU |
Europe | ECL W | CL QF | CL QF | CL W | CL Rd 16 | EL W |
Financial Summary
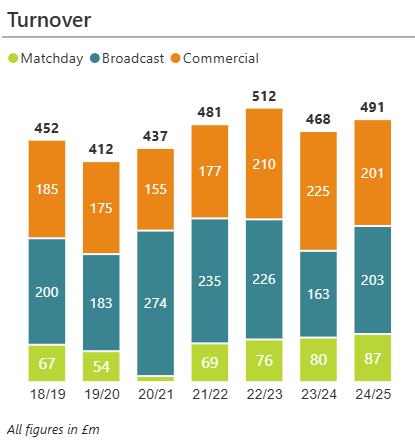
Turnover
Revenue derived from the club’s main operations, excluding player transfer income. The key sources include:
Matchday income from ticket sales,
Broadcasting income from central distributions from the Premier League, UEFA payments for participation in European tournaments, FIFA payments for participations in the Club World Cup and income generated through the club’s media platform.
Commercial income from sponsorships, merchandising, non-football events, tours and other commercial activities.
Other Revenue from football related activities not covered by the above categories, including player loan fees received.

Staff Costs
Total staff costs include:
Salaries and wages paid to all employees,
Amortisation of transfer fees (spreading the cost of a player’s acquisition costs over the length of their contract),
Impairments incurred when a player’s estimated current market value falls below their book value.
Total staff costs are offset by profits from player sales when the net proceeds (transfer fee received minus any related costs) exceed the player’s net book value


Profit and Loss
The key measures of profitability are:
EBITDA (Earnings Before Interest, Tax, Depreciation and Amortisation) measures the club’s profitability before non-cash charges and financing costs.
Operating Profit represents EBITDA less non-cash expenses, including depreciation of fixed assets and amortisation of player transfer fees.
Profit Before Tax is the club’s overall financial result before corporation tax, after accounting for all costs,


Net Assets
Net assets represent the difference between total assets and total liabilities and correspond to the club’s net equity.
Assets include fixed assets—such as player registrations, facilities, and goodwill—as well as current assets like trade debtors, transfer fees receivable, and cash.
Liabilities comprise loans (from banks, shareholders, or group companies), transfer fees payable, trade creditors, deferred income (for example, advance season ticket sales), and other financial provisions.


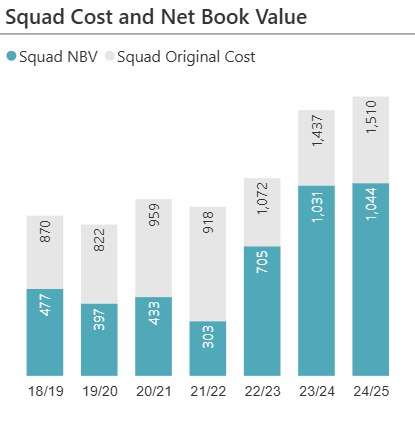
Player Trading
Buying and selling players impacts several financial measures:
Net player trading is the difference between player acquisition costs and income from player sales.
Net Book Value is the total acquisition cost less accumulated amortisation (the write down of the player’s acquisition costs over the length of their contract) and reflects the remaining book value of the squad.
Total Squad Cost is the total acquisition cost of the current squad.
Market Value is the aggregate market value of the squad as estimated by transfermarkt.com.
Value add is the difference between market value and net book value.

Football Net Debt
Football net debt represents the total amount owed by a club. It includes:
Third party loans, such as bank borrowings or other financial institutions.
Related part loans from owners or other related entities (for example, a parent company or directly from the owner). These 'shareholder' loans are often converted to equity at a later date.
Transfer fees owed to other clubs, net of transfer fees receivable as transfer fees are often settled over several years.


Cash Flow
Cash Flows are reported in three categories:
Cash Flows from Operations refer to cash generated from the club’s core activities—revenue less day-to-day operating costs.
Cash Flows from Investments includes cash spent on player acquisitions and facility improvements, net of player or asset sales.
Cash Flows from Financing covers new loans or equity raised, less repayments or buybacks. If operational cash flow cannot fund investments, the shortfall is usually met through financing.


Reporting Entity
Year | Reporting Entity (link) | Period | Periods | Majority Owner |
2019/20 | 1st July 2019 - 30th June 2020 | 12 | Roman Abramovich | |
2020/21 | 1st July 2020 - 30th June 2021 | 12 | Roman Abramovich | |
2021/22 | 1st July 2021 - 30th June 2022 | 12 | Blueco (Todd Boehly & Clearlake Capital) | |
2022/23 | 1st July 2022 - 30th June 2023 | 12 | Blueco (Todd Boehly & Clearlake Capital) | |
2023/24 | 1st July 2023 - 30th June 2024 | 12 | Blueco (Todd Boehly & Clearlake Capital) | |
2024/25 | 1st July 2024 - 30th June 2025 | 12 | Blueco (Todd Boehly & Clearlake Capital) |
The reports represent Matchday Finance’s interpretation of the club’s published accounts. While every effort has been made to ensure the accuracy and completeness of the information presented, Matchday Finance makes no representations, warranties or guarantees, whether express or implied, as to the accuracy, reliability or completeness of the data. Users should not rely solely on this information for financial, investment or commercial decision-making and should refer to the club’s published accounts for official figures.


Comments